- Cold weather cuts into petroleum market activity
- Heating Degree Days explode in Central states
- Gasoline demand suffers
- Natural gas inventories show near-record withdrawal
The Matrix
Energy futures prices moved higher last week. Crude oil added $4.76 to its front-month value and product values had commensurate gains. The international situation has become precarious, with aggressive activity on shipping by Yemeni Houthis the headline story.
The U.S. Petroleum Balance Sheet for the week ending January 19 offered mixed results. Refinery runs fell sharply. Total runs lost 1.377 million barrels daily reflecting in part a one million barrels daily reduction in domestic crude oil production.
Particularly cold weather slowed – and even shut in – production activity in Texas and other critical petroleum centers. And Heating Degree Days showed it. The United States added 262 HDDs for the week ending January 20. The East and West Central states exceeded normal HDD generation by 107 degrees.
Nationally, the country still lags normal HDD compared with both last year and normal for the Climate Prediction Center’s fiscal year starting July 1, 2023. HDDs were 229 degrees below normal and only 39 degrees less than last year.
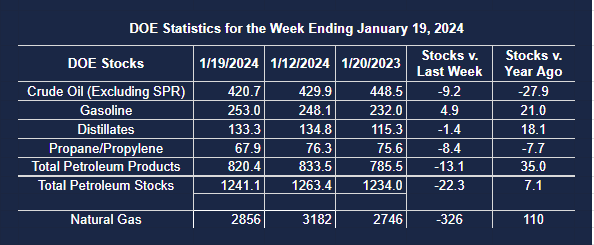
Stocks of petroleum fell 22.3 million barrels during the report week. Crude oil accounted for 9.2 million barrels of the loss.
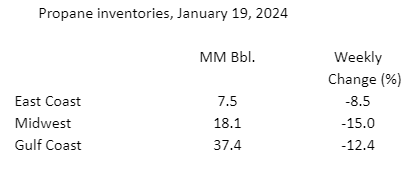
Propane supplies fell by 8.7 million barrels. Propane inventories tend to be smaller than other fuels, but relative weekly changes show where weather most influenced supplies.
Distillate fuel oil inventories fell by 1.4 million barrels. Here, too, weather influenced activity. The East Coast, where home heating oil is principally used, had less weather interference than the central states, and less impact on supply.
Weather impacted consumption as well. Total demand for the week ending January 19th was 19.6 million barrels daily, 312,000 barrels per day less than during the prior week.
Gasoline demand lost 388,000 barrels per day. Inventories rose by 4.9 million daily barrels.
Supply/Demand Balances
Supply/demand data in the United States for the week ending January 19, 2023 were released by the Energy Information Administration.
Total commercial stocks of petroleum fell (⬇) 22.3 million barrels to 1.2411 billion barrels during the week ending January 19, 2023.
Commercial crude oil supplies in the United States were lower (⬇) by 9.2 million barrels from the previous report week to 420.7 million barrels.
Crude oil inventory changes by PAD District:
PADD 1: Down (⬇) 0.2 million barrels to 7.6 million barrels
PADD 2: Down (⬇) 5.2 million barrels to 108.9 million barrels
PADD 3: Down (⬇) 3.8 million barrels to 232.0 million barrels
PADD 4: Down (⬇) 1.5 million barrels to 23.6 million barrels
PADD 5: Up (⬆) 1.5 million barrels to 48.5 million barrels
Cushing, Oklahoma inventories were down (⬇) 2.0 million barrels from the previous report week to 30.1 million barrels.
Domestic crude oil production was down (⬇) 1.0 million barrels at 12.3 million barrels daily.
Crude oil imports averaged 5.580 million barrels per day, a daily decrease (⬇) of 1.840 million barrels. Exports decreased (⬇) 595,000 barrels daily to 4.434 million barrels per day.
Refineries used 85.5 percent of capacity; 7.1 percentage points lower (⬇) than the previous report week.
Crude oil inputs to refineries decreased (⬇) 1.377 million barrels daily; there were 15.276 million barrels per day of crude oil run to facilities. Gross inputs, which include blending stocks, decreased (⬇) 1.293 million barrels daily to 15.628 million barrels daily.
Total petroleum product inventories decreased (⬇) by 13.1 million barrels from the previous report week, down to 820.4 million barrels.
Total product demand decreased (⬇) 312,000 barrels daily to 19.556 million barrels per day.
Gasoline stocks increased (⬆) 4.9 million barrels from the previous report week; total stocks are 253.0 million barrels.
Demand for gasoline decreased (⬇) 388,000 barrels per day to 7.880 million barrels per day.
Distillate fuel oil stocks decreased (⬇) 1.4 million barrels from the previous report week; distillate stocks are at 133.3 million barrels. EIA reported national distillate demand at 3.784 million barrels per day during the report week, an increase (⬆) of 139,000 barrels daily.
Propane stocks decreased (⬇) by 8.4 million barrels from the previous report week to 67.9 million barrels. The report estimated current demand at 1.527 million barrels per day, an increase (⬆) of 130,000 barrels daily from the previous report week.
Natural Gas
Spot futures natural gas prices moved lower last week. This continued a trend that has been in place since late October when prices topped $3.630. Last week’s price settled at $2.172, moving closer to the April low of $1.946.
The Climate Prediction Center predicts the El Nino weather pattern will remain strong through March in the Northern Hemisphere. The group puts the likelihood that El Nino will continue to deliver warmer weather in the region at greater than 55 percent. Other analysts have added that El Nino will limit Canadian snowfall, further limiting HDD development this winter.
Domestic supplies of natural gas took a major hit in EIA’s release of natural gas in underground storage for the week ending January 19. Withdrawals from storage were 326 Bcf, the third-largest weekly reduction in supply ever recorded.
The country is, nonetheless, well supplied with methane. There were 2.856 Tcf of natural gas available, five percent more than the average of the past five years.
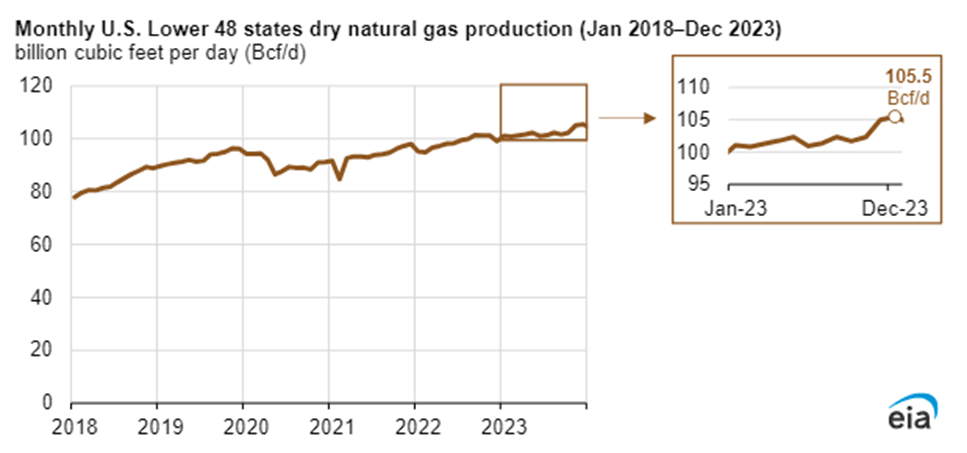
Monthly production of dry natural gas reached 105.5 Bcf/d last December. This set a record for output. It also continued the pattern of steadily rising dry production in place since 2018.
Three geological regions, Appalachia, Permian, and Anadarko, together accounted for nearly 90 percent of the gain in the lower 48 states. In Appalachia, transportation capacity for natural gas explained much of the gain in supply. The increase was centered in the Marcellus shale in West Virginia and Pennsylvania.
The gain in production occurred at a slower pace in 2023 than in the previous year. This is the first slowdown since at least 2020. It may not have any analytical importance.
An economy growing at strong post-pandemic rates will inevitably require natural gas to support electric generation.
According to the EIA:
- Net withdrawals from storage totaled 326 Bcf for the week ending January 19, compared with the five-year (2019–2023) average net withdrawals of 148 Bcf and last year’s net withdrawals of 86 Bcf during the same week. This is the third-largest withdrawal on record. Working natural gas stocks totaled 2,856 Bcf, which is 142 Bcf (5%) more than the five-year average and 110 Bcf (4%) more than last year at this time.
- According to The Desk survey of natural gas analysts, estimates of the weekly net change to working natural gas stocks ranged from net withdrawals of 295 Bcf to 376 Bcf, with a median estimate of 328 Bcf.
- The average rate of withdrawals from storage is 4% higher than the five-year average so far in the withdrawal season (November through March). If the rate of withdrawals from storage matched the five-year average of 15.0 Bcf/d for the remainder of the withdrawal season, the total inventory would be 1,775 Bcf on March 31, which is 142 Bcf higher than the five-year average of 1,633 Bcf for that time of year.