- Distillate fuel oil supplies very tight
- Crude oil prices pullback
- Natural gas situation becoming more bearish
- Happy Thanksgiving from the Powerhouse Team
The Matrix
Crude oil prices reversed sharply higher on Friday, following a $72.37 Thursday low. The recovery was impressive, adding nearly three dollars to the value of WTI, (4.1 percent.) Monday’s trading added to that gain, however, despite the two-day rally, the front-month contract has yet to decisively break the current down trend.
WTI crude oil prices have been falling since September 28th, when they reached $95.03, a critical high. They have subsequently lost substantial value in what appears to be a full-throated five-wave Elliott Wave decline. The pattern suggests a bottom around $68, or even $63.57, a major low seen last on May 4, 2023.
The fall in price has occurred on moderate daily volumes and declining open interest. This could represent liquidation on long positions rather than establishment of new shorts. Seasonality and year-end tax-induced market activity support this idea.
The year is ending with total inventories of crude oil and petroleum product stocks about equal to the average of the past five years. This is a marked improvement over last year, when inventories lagged by nearly four percent, roughly the minimum available over the past five years.
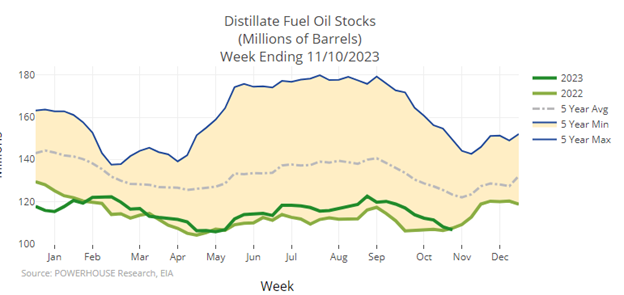
This equality does not hold among major products. The supply of distillate fuel oil, the engine of the economy, is tight. Stocks stand at 106.6 million barrels as of November 10th, slightly above the “minimum operating level” generally seen as needed to keep the supply system functioning.
This comes at a time when refineries in the United States are operating at 86.1 percent of capacity. Last year, facilities were running at 92.9 percent of capacity at this time. A busy fall maintenance period is reportedly coming to an end, potentially easing the problems for distillate fuel oil.
Stocks of motor gasoline are near the average of the past five years. The urgency to build gasoline stocks is therefore, eased as well.
Supply/Demand Balances
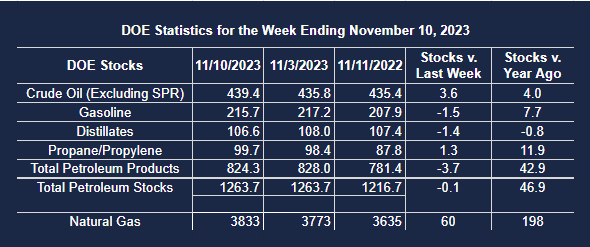
Supply/demand data in the United States for the week ending November 10, 2023 were released by the Energy Information Administration.
Total commercial stocks of petroleum fell (⬇) 0.1 million barrels to 1.2637 billion barrels during the week ending November 10, 2023.
Commercial crude oil supplies in the United States were higher (⬆) by 3.6 million barrels from the previous report week to 439.4 million barrels.
Crude oil inventory changes by PAD District:
PADD 1: Up (⬆) 0.8 million barrels to 9.5 million barrels
PADD 2: Up (⬆) 4.2 million barrels to 108.1 million barrels
PADD 3: Down (⬇) 0.8 million barrels to 252.4 million barrels
PADD 4: Down (⬇) 0.3 million barrels to 22.9 million barrels
PADD 5: Down (⬇) 0.1 million barrels to 46.5 million barrels
Cushing, Oklahoma inventories were up (⬆) 1.9 million barrels from the previous report week to 25.0 million barrels.
Domestic crude oil production was unchanged (=) at 13.2 million barrels daily.
Crude oil imports averaged 6.373 million barrels per day, a daily decrease (⬇) of 21,000 barrels. Exports increased (⬆) 364,000 barrels daily to 4.889 million barrels per day.
Refineries used 86.1 percent of capacity; 0.9 percentage points higher (⬆) than the previous report week.
Crude oil inputs to refineries increased (⬆) 164,000 barrels daily; there were 15.399 million barrels per day of crude oil run to facilities. Gross inputs, which include blending stocks, increased (⬆) 178,000 barrels daily to 15.740 million barrels daily.
Total petroleum product inventories decreased (⬇) by 3.6 million barrels from the previous report week, up to 824.3 million barrels.
Total product demand decreased (⬇) 1.642 million barrels daily to 20.080 million barrels per day.
Gasoline stocks decreased (⬇) 1.5 million barrels from the previous report week; total stocks are 215.7 million barrels.
Demand for gasoline decreased (⬇) 544,000 barrels per day to 8.949 million barrels per day.
Distillate fuel oil stocks decreased (⬇) 1.4 million barrels from the previous report week; distillate stocks are at 106.6 million barrels. EIA reported national distillate demand at 4.109 million barrels per day during the report week, a decrease (⬇) of 189,000 barrels daily.
Propane stocks increased (⬆) by 1.3 million barrels from the previous report week to 99.7 million barrels. The report estimated current demand at 854,000 barrels per day, a decrease (⬇) of 437,000 barrels daily from the previous report week.
Natural Gas
Stocks of natural gas in underground storage ended the refill season above the five-year average. There were 3.776 Tcf of natural gas stored at the end of the refill season on October 31, 2023. This was 5 percent more than the five-year average and 6.8 percent more than last year at this time. Only the winter of 2020 began with even higher levels of supply over the past five years.

Source: EIA
NYMEX natural gas front-month price has fallen to levels just above the $2.861 intra-day low reached on October 23rd. A break below this level opens the possibility of a test down to the $2.55 level.
The relatively high storage level recorded for the beginning of this winter and below-normal generation of heating degree days conduce toward lower prices in general.
Moreover, markets in Europe that needed a bail out last year as the Russia-Ukraine war heated up, are less strained today. Natural gas storage in Europe is almost full as of November 13. Typically, it is not quite 90 percent full at this time of year.
Other market fundamentals supported the bear case too. Production of natural gas last week was 103.3 Bcf/d, (+4.3 percent year on year.) Demand in in the lower 48 states was reported to be 73.0 Bcf/d, 2.7 percent below last year at this time.

According to the EIA:
- For the week ending November 10, net injections into storage totaled 60 Bcf compared with the five-year (2018–2022) average net injections of 20 Bcf and last year’s net injections of 66 Bcf during the same week. Working natural gas stocks totaled 3,833 Bcf, which is 203 Bcf (6%) more than the five-year average and 198 Bcf (5%) more than last year at this time.
- According to The Desk survey of natural gas analysts, for the week ending November 10, estimates of the weekly net change to working natural gas stocks ranged from net injections of 24 Bcf to 68 Bcf, with a median estimate of 44 Bcf.
- For the week ending November 3, net withdrawals from storage totaled 6 Bcf compared with the five-year (2018–2022) average net injections of 36 Bcf and last year’s net injections of 83 Bcf during the same week. Working natural gas stocks totaled 3,773 Bcf, which was 163 Bcf (5%) more than the five-year average and 204 Bcf (6%) more than last year at that time.
- According to The Desk survey of natural gas analysts, for the week ending November 3, estimates of the weekly net change to working natural gas stocks ranged from net withdrawals of 18 Bcf to net injections of 5 Bcf, with a median estimate of net withdrawals of 6 Bcf.