- Crude oil supplies are being squeezed
- Oil demand reaches new record
- U.S. producers diverting funds from Exploration and Development
- Natural gas recovers

The Matrix
Exploration and development spending are significant budgetary items for American upstream companies. But recent data show that E&D spending has fallen behind rewarding investors with corporate payouts for dividends and share buybacks.
Tight product supply and expectations of growth in global oil demand suggest a continuing need for crude oil supplies. OPEC and Russia have both used oil availability for political purposes, making global crude oil supply always problematical.
Even now, global availabilities are constricting. Inventories in developed countries are 115 million barrels less than their five-year average. Further reductions are expected for the rest of the rest of the year, perhaps by 1.7 million barrels daily.
A corporate policy of diverting funds from finding new oil may prove counterproductive in the event of reduced crude oil supply from established suppliers. Refilling the Strategic Petroleum Reserve is still unfinished. It would be another claimant for new supply.
There have been many reasons to believe that demand for oil has peaked. Demand collapsed during Covid-19. Working from home became important. Emerging concerns for the effects of climate change pushed supply toward renewables.
The reality has proven different. Notwithstanding the growth of alternative supply, the development of electric vehicles and greater efficiency, global demand has reached a new record.
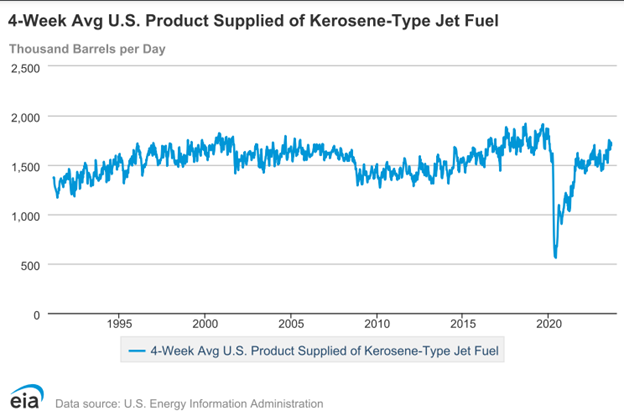
The International Energy Agency put global demand at 103 million barrels daily in June. It expects even higher consumption in August. This reflects strong anticipated demand from China. Demand for air travel has boosted jet fuel consumption and power generation supported by surging Cooling Degree Days.
EIA anticipates a need for 29.8 million daily barrels from OPEC for the rest of the year. In July, the group provided 27.9 million barrels per day. An increase that large will almost certainly affect supply with bullish ramifications for price.
Supply/Demand Balances
Supply/demand data in the United States for the week ending August 18, 2023 were released by the Energy Information Administration.
Total commercial stocks of petroleum fell (⬇) 3.0 million barrels to 1.2628 billion barrels during the week ending August 18, 2023.
Commercial crude oil supplies in the United States were lower (⬇) by 6.1 million barrels from the previous report week to 433.5 million barrels.
Crude oil inventory changes by PAD District:
PADD 1: Down (⬇) 1.5 million barrels to 7.0 million barrels
PADD 2: Down (⬇) 3.3 million barrels to 114.1 million barrels
PADD 3: Unchanged (=) at 243.5 million barrels
PADD 4: Down (⬇) 0.3 million barrels at 23.7 million barrels
PADD 5: Down (⬇) 1.0 million barrels to 45.2 million barrels
Cushing, Oklahoma inventories were down (⬇) 3.1 million barrels from the previous report week to 30.7 million barrels.
Domestic crude oil production was up (⬆) 100,000 barrels at 12.8 million barrels daily.
Crude oil imports averaged 6.933 million barrels per day, a daily decrease (⬇) of 225,000 barrels. Exports decreased (⬇) 341,000 barrels daily to 4.258 million barrels per day.
Refineries used 94.5 percent of capacity; 0.2 percentage points lower (⬇) than the previous report week.
Crude oil inputs to refineries increased (⬆) 30,000 barrels daily; there were 16.776 million barrels per day of crude oil run to facilities. Gross inputs, which include blending stocks, decreased (⬇) 44,000 barrels daily to 17.258 million barrels daily.
Total petroleum product inventories increased (⬆) by 3.2 million barrels from the previous report week, up to 829.3 million barrels.
Total product demand decreased (⬇) 498,000 barrels daily to 21.165 million barrels per day.
Gasoline stocks increased (⬆) 1.5 million barrels from the previous report week; total stocks are 217.6 million barrels.
Demand for gasoline increased (⬆) 59,000 barrels per day to 8.910 million barrels per day.
Distillate fuel oil stocks increased (⬆) 0.9 million barrels from the previous report week; distillate stocks are at 116.7 million barrels. EIA reported national distillate demand at 3.836 million barrels per day during the report week, an increase (⬆) of 188,000 barrels daily.
Propane stocks increased (⬆) by 1.7 million barrels from the previous report week to 92.3 million barrels. The report estimated current demand at 974,000 barrels per day, a decrease (⬇) of 270,000 barrels daily from the previous report week.
Natural Gas
Spot natural gas futures appear to have reversed a down trend that topped around $3.02 on August 9. Spot futures fell to $2.53 last week, and a recovery this Monday to $2.74 followed.
Reasons for a recovery may have included a report of only 18 Bcf injected into underground storage. Markets expected additions to supply of 31 Bcf for the report week. This was well below the average injection for the week over the past five years of 49 Bcf. Adding to the bullish tone, the number of active natural gas drilling rigs was only 115 derricks, the lowest since September, 2022.
The Energy Information Agency has reported bearish storage data most recently (see below,) ten percent more than the average of the past five years and twenty percent more than last year.
Late summer-early autumn rallies in natural gas futures prices are typical. The surplus of domestic natural gas in storage has cast some question on the prospects of a rally this year. Futures for January 2025 price natural gas at $4.544 per MMBtu. This is well more than normal carry.
Natural gas is now traded internationally. This subjects it to global events that were remote to U.S. pricing before the development of LNG and the ability to carry gas on ocean-going vessels. Adequate domestic supply now competes with newly-available foreign markets, especially Europe, and Russia’s possible use of its own natural gas exports as economic weapons.
European natural gas prices may be a leading indicator for the next move in natural gas. Prices in the EU have moved substantially higher in recent weeks, and as prices move higher heading toward winter, competition from these markets could pull US. prices higher, notwithstanding sufficient domestic supply.
Net injections into storage totaled 18 Bcf for the week ending August 18, compared with the five-year (2018–2022) average net injections of 49 Bcf and last year’s net injections of 54 Bcf during the same week. Working natural gas stocks totaled 3,083 Bcf, which is 268 Bcf (10%) more than the five-year average and 513 Bcf (20%) more than last year at this time.
From: EIA
According to The Desk survey of natural gas analysts, estimates of the weekly net change to working natural gas stocks ranged from net injections of 25 Bcf to 39 Bcf, with a median estimate of 31 Bcf.
The average rate of injections into storage is 2% lower than the five-year average so far in the refill season (April through October). If the rate of injections into storage matched the five-year average of 10.5 Bcf/d for the remainder of the refill season, the total inventory would be 3,863 Bcf on October 31, which is 268 Bcf higher than the five-year average of 3,595 Bcf for that time of year.