- Record crude stock draw mostly due to adjustment
- Saudi Arabia extends production cuts into September
- Global distillate stocks are running below average
- Natural gas prices remain rangebound
Sincerely,
Elaine Levin, President
Powerhouse
(202) 333-5380

The Matrix
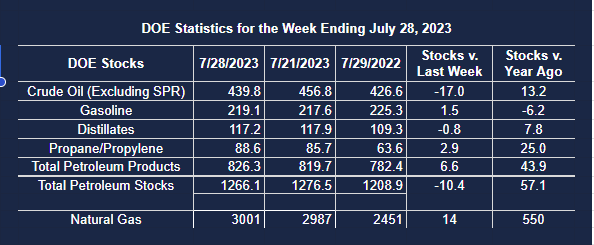
The headline-making statistic from last week’s EIA report was a 17 million barrel decline in U.S. crude oil inventories. Yet, the record-breaking stock reduction generated a muted response from traders. What did move the needle was the announcement that Saudi Arabia would extend its one million barrel per day cut in production that began in July. OPEC’s largest producer will continue to reduce output through September and could “extend or extend and deepen” the cut in the future, according to sources. WTI futures finished the week within striking distance of the April 2023 high of $83.53. Diesel prices registered a sixth consecutive week higher, finishing at prices not seen since early 2023. With the pledge from OPEC’s most prominent member to restrain output, concerns about a tighter winter continue to grow.
Adjustments in crude oil inventory from the EIA are not unusual. Domestic crude oil production combined with imports should equal the inputs to refineries plus exports, plus or minus the change in inventories. The EIA states, “Ideally, the sum of the elements of the crude oil balance relationship, which are developed independently, should balance perfectly. In practice, this is rarely the case because timing differences or other factors that contribute to survey responses may not precisely reflect actual crude oil import, storage, and refining activity for the week or weekly estimates of crude oil exports and production over- or under-estimate the actual values.”
As monthly data becomes available, the EIA will occasionally need to adjust in order to balance the equation. Only 3 million barrels of last week’s draw was due to changes in supply and demand. The additional 14 million barrels of the decline in crude oil stocks was attributed to an “adjustment factor” already anticipated by market watchers.
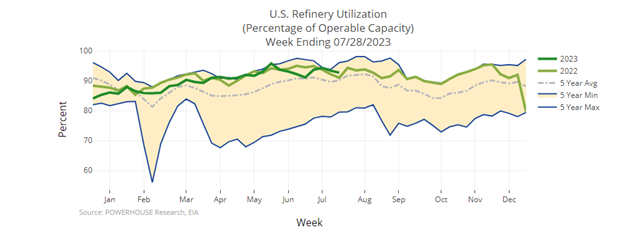
Domestic distillate stocks fell by 800,000 barrels. Even with the incentive of diesel crack spreads trading over $40.00, refinery utilization fell 0.7% to 92.7%. Extreme temperatures throughout the south are taking a toll on a refinery operation. During the refining process, heated crude oil produces liquids and vapors, which are cooled and separated into petroleum products. High heat interferes with the cooling process. It is not uncommon for refineries to slow production during times of scorching temperatures. What is unusual is the duration of this year’s heat wave.

Distillate inventories continue to run well below average in Europe, Singapore, and at home. We are a few weeks away from the typical peak of hurricane season. With little room for error in the system, any issue that impacts refining can push prices higher. Even if headlines turn more bearish, Saudi Arabia has signaled a willingness to support price. If your business is exposed rising prices of fuel this fall and winter, you should consider hedging the price risk to the bottom line.
Supply/Demand Balances
Supply/demand data in the United States for the week ending July 28, 2023 were released by the Energy Information Administration.
Total commercial stocks of petroleum fell (⬇) 10.4 million barrels to 1.2661 billion barrels during the week ending July 28, 2023.
Commercial crude oil supplies in the United States were lower (⬇) by 17.0 million barrels from the previous report week to 439.8 million barrels.
Crude oil inventory changes by PAD District:
PADD 1: Down (⬇) 0.3 million barrels to 7.8 million barrels
PADD 2: Up (⬆) 0.4 million barrels to 119.4 million barrels
PADD 3: Down (⬇) 15.6 million barrels to 243.4 million barrels
PADD 4: Unchanged (=) at 24.2 million barrels
PADD 5: Down (⬇) 1.6 million barrels to 45.0 million barrels
Cushing, Oklahoma inventories were down (⬇) 1.2 million barrels from the previous report week to 34.5 million barrels. Domestic crude oil production was unchanged (=) at 12.2 million barrels daily.
Crude oil imports averaged 6.668 million barrels per day, a daily increase (⬆) of 301,000 barrels. Exports increased (⬆) 692,000 barrels daily to 5.283 million barrels per day.
Refineries used 92.7 percent of capacity; 0.7 percentage points lower (⬇) than the previous report week.
Crude oil inputs to refineries increased (⬆) 39,000 barrels daily; there were 16.517 million barrels per day of crude oil run to facilities. Gross inputs, which include blending stocks,decreased (⬇) 138,000 barrels daily to 16.930 million barrels daily.
Total petroleum product inventories increased (⬆) by 6.6 million barrels from the previous report week, up to 826.3 million barrels.
Total product demand decreased (⬇) 1.254 million barrels daily to 20.023 million barrels per day.
Gasoline stocks increased (⬆) 1.5 million barrels from the previous report week; total stocks are 219.1 million barrels.
Demand for gasoline decreased (⬇) 100,000 barrels per day to 8.838 million barrels per day.
Distillate fuel oil stocks decreased (⬇) 0.8 million barrels from the previous report week; distillate stocks are at 117.2 million barrels. EIA reported national distillate demand at 3.826 million barrels per day during the report week, an increase (⬆) of 108,000 barrels daily.
Propane stocks increased (⬆) by 2.9 million barrels from the previous report week to 88.6 million barrels. The report estimated current demand at 885,000 barrels per day, an increase (⬆) of 51,000 barrels daily from the previous report week.
Natural Gas
natural gas prices finished at the lower end of the trading range that has been in place throughout the month of July. The area of support around $2.45 held. A move above $2.85 would be needed to break out of the upside of the range.
From the EIA:
Working gas in storage was 3,001 Bcf as of Friday, July 28, 2023, according to EIA estimates. This represents a net increase of 14 Bcf from the previous week. Stocks were 550 Bcf higher than last year at this time and 322 Bcf above the five-year average of 2,679 Bcf. At 3,001 Bcf, total working gas is within the five-year historical range.
EIA Weekly Summary
