- OPEC cuts are voluntary
- Angola rejects mandate to cut output
- U.S. distillate fuel oil inventory situation may be improving
- Natural gas outlook growing more bearish
The Matrix
Strains among OPEC+ members appear to be growing. Last week, the group announced a production cut of marginally less than one million barrels daily. Unlike other cuts initiated by the group, details on the cuts were nebulous at best. The result amounted to those that could cut output should do so; those that were reluctant to cut were given a pass.
A mandate for output control so indefinite is no mandate at all. The usual suspects, notably Saudi Arabia, have announced output cuts. But even here, the Saudis have not announced further cuts. The Kingdom has said it will maintain its “unilateral crude production cuts of 1.0 million barrels per day through the first quarter, 2024.” It would, however, reduce voluntary exports by 200,000 daily barrels to 500,000 barrels per day in the first quarter.
Russia has announced an additional cut in its exports by 200,000 barrels daily during the first quarter of 2024.
And Angola, Africa’s second largest producer and an OPEC member, has rejected the idea of an output cut, publicly announcing that it will produce more than its quota. It expects to produce 1.18 million barrels daily in January, 700,000 barrels daily more than its official quota.
Another unusual feature of the production cutback was the way in which the cuts will be announced. Final details, including new national output levels, are to be announced by individual countries rather than by the group. As more OPEC members reach the limits of their ability to fund government with oil revenues, this development must be seen as a weaking of the OPEC structure itself.
Domestically, stocks of distillate fuel oil remain under pressure. Inventories are ten percent below the average of the past five years.

But stocks of distillate fuel oil rose 5.2 million barrels for the week ending November 24. And this comes at a time when El Nino is reducing HDD demand. The ISM Manufacturing PMI reading for November stalled, coming in 0.9 below expectations at 46.7. We may dodge a bullet on distillate prices this winter, but at the cost of a contracting manufacturing sector.
Supply/Demand Balances
Supply/demand data in the United States for the week ending November 24, 2023 were released by the Energy Information Administration.
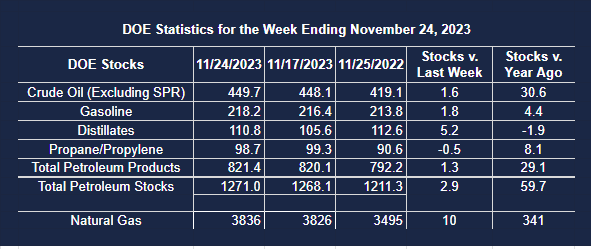
Total commercial stocks of petroleum rose (⬆) 2.9 million barrels to 1.2710 billion barrels during the week ending November 24, 2023.
Commercial crude oil supplies in the United States were higher (⬆) by 1.6 million barrels from the previous report week to 449.7 million barrels.
Crude oil inventory changes by PAD District:
PADD 1: Up (⬆) 1.8 million barrels to 10.2 million barrels
PADD 2: Up (⬆) 0.3 million barrels to 109.5 million barrels
PADD 3: Down (⬇) 1.5 million barrels to 256.4 million barrels
PADD 4: Up (⬆) 0.4 million barrels to 24.6 million barrels
PADD 5: Up (⬆) 0.7 million barrels to 29.0 million barrels
Cushing, Oklahoma inventories were up (⬆) 1.8 million barrels from the previous report week to 27.7 million barrels.
Domestic crude oil production was unchanged (=) at 13.2 million barrels daily.
Crude oil imports averaged 5.833 million barrels per day, a daily decrease (⬇) of 696,000 barrels. Exports decreased (⬇) 31,000 barrels daily to 4.755 million barrels per day.
Refineries used 89.8 percent of capacity; 2.8 percentage points higher (⬆) than the previous report week.
Crude oil inputs to refineries increased (⬆) 518,000 barrels daily; there were 16.022 million barrels per day of crude oil run to facilities. Gross inputs, which include blending stocks, increased (⬆) 515,000 barrels daily to 16.416 million barrels daily.
Total petroleum product inventories increased (⬆) by 1.3 million barrels from the previous report week, up to 821.3 million barrels.
Total product demand decreased (⬇) 1.125 million barrels daily to 18.917 million barrels per day.
Gasoline stocks increased (⬆) 1.8 million barrels from the previous report week; total stocks are 218.2 million barrels.
Demand for gasoline decreased (⬇) 274,000 barrels per day to 8.206 million barrels per day.
Distillate fuel oil stocks increased (⬆) 5.2 million barrels from the previous report week; distillate stocks are at 110.8 million barrels. EIA reported national distillate demand at 3.014 million barrels per day during the report week, a decrease (⬇) of 1.096 million barrels daily.
Propane stocks decreased (⬇) by 0.5 million barrels from the previous report week to 98.7 million barrels. The report estimated current demand at 1.215 million barrels per day, an increase (⬆) of 233,000 barrels daily from the previous report week.
Natural Gas
Spot natural gas futures prices spent last week below $3.00 for the first time since October 2. Without a dramatic shift in weather patterns, bearish market sentiment remains firmly in control.
Heating Degree Days continue to fail normal levels. Data for the week ending November 23 showing a national HDD shortfall of 17 degrees. The comparison against last year is even more bearish. NOAA put the shortfall at 61 HDDs. Each of NOAA’s nine geographic regions fell short. The East South-Central regions missed by 90 HDDs, and the population rich Middle Atlantic states failed by 53 HDDs.
Ten Bcf of natural gas were injected into storage during the week ending November 24. Notably, an injection so late in the year, when withdrawals are the norm, has not occurred over the past ten years.
Powerhouse has emphasized the growth in U.S. exports of LNG in recent years. This has raised our national profile in the international LNG trade. But focusing on our own success should not continuing importance of other exporting countries. Some of them have long-standing histories of global supply.
The the Middle East and North Africa (MENA) region provided nearly 30 percent of global LNG exports in 2022. But as the importance of LNG grows, that share has been in retreat. MENA exported 47 percent of all LNG exports in 2013. Since then, however, exports from Australia and the United States have added to their shares.
Qatar supplied 70 percent of MENA exports in 2022. The county’s exports have averaged 10.3 Bcf daily over the past ten years. Another long-term regional supplier is Oman which has been exporting since 2000, averaging 1.2 Bcf/d over the past ten years.
In North Africa, Algeria has been exporting LNG for over 40 years. The nation has substantial reserves but output suffers beaus of insufficient production investment. Domestic demand is rising as well.
LNG exports from Yemen averaged just below 1.0 Bcf/d until military conflict stopped production. An end to that war could add even more to global LNG supply balances.
According to the EIA:
- Net injections into storage totaled 10 Bcf for the week ending November 24, compared with the five-year (2018–2022) average net withdrawals of 44 Bcf and last year’s net withdrawals of 80 Bcf during the same week. Working natural gas stocks totaled 3,836 Bcf, which is 303 Bcf (9%) more than the five-year average and 341 Bcf (10%) more than last year at this time. We have not reported a net injection this late in November in the last 10 years.
- According to The Desk survey of natural gas analysts, estimates of the weekly net change to working natural gas stocks ranged from net withdrawals of 18 Bcf to net injections of 10 Bcf, with a median estimate of net withdrawals of 3 Bcf.