- Inventories are generally below historical averages
- Heating Degree Days lag significantly
- Middle East hostilities could expand to Lebanon
- Natural gas prices continue to soften
The Matrix
Futures prices for crude oil and principal oil products closed the week ending February 23 slightly lower than during the week before. This was despite small declines in petroleum product futures and a modest gain in weekly WTI crude oil supplies.
Inventories of crude oil in the United States increased by 3.5 million barrels daily for the week ending February 16. The Gulf Coast and the Midwest had gains of 2 million barrels and 1.8 million barrels respectively, with small declines elsewhere.
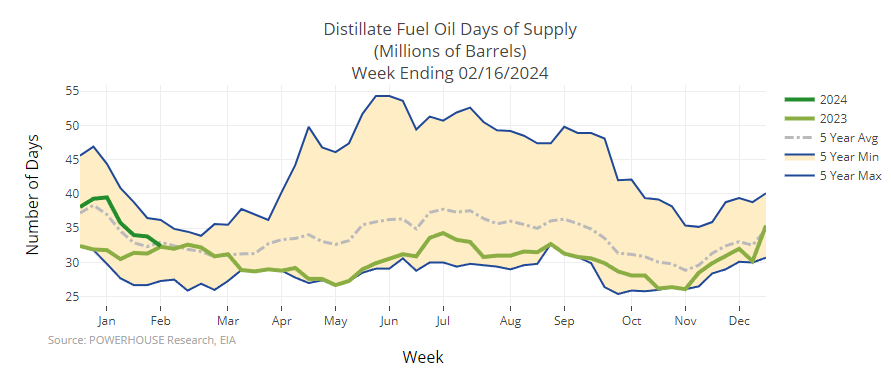
Stocks are generally lower than historical averages as winter moves toward its close. The situation for distillate fuel oil is especially concerning. Inventories are 10.4 percent lower than the five-year average.
Crude oil supplies are 1.8 percent lower than the average of the past five years at this time. Gasoline inventories are similarly 1.8 percent lower.
The Powerhouse chart of distillate fuel oil days of supply shows declining inventories. Weather, as amply demonstrated this season, has not taken as much stock as usual.
Heating Degree Days generated this fiscal year by NOAA’s Climate Prediction Center continue to lag normal as it has all year. The nation has produced 376 HDDs fewer than normal through February 17 from July 1, 2023.
The Eastern half of the nation has been particularly affected. New England lags behind normal by 595 HDDs, and the Middle Atlantic region by 458 HDDs. By far the worst affected has been the West North Central region, where 772 HDDs less than normal have developed.
International events have continued to matter, with the usual suspects in play. One hopeful sign is a report that Israel will send negotiators to discuss a ceasefire and repatriation of Israeli hostages.
Concerns are developing that the Israel-Hamas war could expand to Lebanon. Hezbollah, Iran’s proxy in the region, has been trading weapons barrages with Israel since the Hamas invasion occurred on October 7, 2023.
Supply/Demand Balances
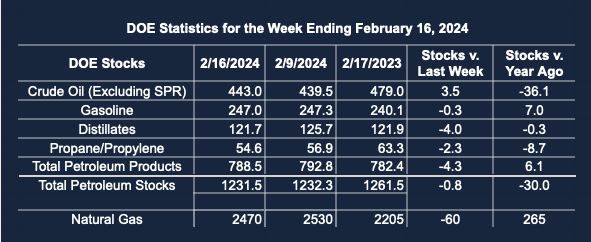
Supply/demand data in the United States for the week ending February 16, 2024 were released by the Energy Information Administration.
Total commercial stocks of petroleum fell (⬇) 0.8 million barrels to 1.2315 billion barrels during the week ending February 9, 2024.
Commercial crude oil supplies in the United States were higher (⬆) by 3.5 million barrels from the previous report week to 443.0 million barrels.
Crude oil inventory changes by PAD District:
PADD 1: Down (⬇) 0.5 million barrels 7.2 million barrels
PADD 2: Up (⬆) 1.8 million barrels to 114.1 million barrels
PADD 3: Up (⬆) 2.0 million barrels to 250.3 million barrels
PADD 4: Up (⬆) 0.3 million barrels to 24.6 million barrels
PADD 5: Down (⬇) 0.1 million barrels to 46.8 million barrels
Cushing, Oklahoma inventories were up (⬆) 0.7 million barrels at 29.5 million barrels.
Domestic crude oil production was unchanged (=) at 13.3 million barrels daily.
Crude oil imports averaged 6.654 million barrels per day, a daily increase (⬆) of 184,000 barrels. Exports increased (⬆) 618,000 barrels daily to 4.965 million barrels per day.
Refineries used 80.6 percent of capacity; unchanged (=) from the previous report week.
Crude oil inputs to refineries increased (⬆) 32,000 barrels daily; there were 14.574 million barrels per day of crude oil run to facilities. Gross inputs, which include blending stocks, increased (⬆) 2,002 barrels daily to 14.780 million barrels daily.
Total petroleum product inventories decreased (⬇) by 4.3 million barrels from the previous report week, down to 788.5 million barrels.
Total product demand decreased (⬇) 336,000 barrels daily to 18.918 million barrels per day.
Gasoline stocks decreased (⬇) 0.3 million barrels from the previous report week; total stocks are 247.0 million barrels.
Demand for gasoline increased (⬆) 32,000 barrels per day to 8.200 million barrels per day.
Distillate fuel oil stocks decreased (⬇) 4.0 million barrels from the previous report week; distillate stocks are at 121.7 million barrels. EIA reported national distillate demand at 3.940 million barrels per day during the report week, a increase (⬆) of 426,000 barrels daily.
Propane stocks decreased (⬇) by 2.3 million barrels from the previous report week to 54.6 million barrels. The report estimated current demand at 1.030 million barrels per day, an decrease (⬇) of 303,000 barrels daily from the previous report week.
Natural Gas
Spot Henry Hub natural gas futures prices fell to $1.60 on February 20. An unenthusiastic rally followed but fell apart on Friday, February 23. The week ended at $1.699 for front month futures.
The closure of one of three production trains at Freeport Texas has benefitted the domestic supply outlook. Ironically, the outage stems from repairs needed following extreme regional cold that damaged equipment.
The week ending February 16 confirmed the growing natural gas storage surplus. Withdrawals from underground storage of 50 Bcf were well below the comparable lift last year and against the average of the past five years. The rate of withdrawals this season is 17% below the five-year average. EIA anticipates a season-ending supply of 2.1 Tcf in storage as of March 31.
The calendar is working against the possibility of a price recovery this winter. February is nearly over, and the advance of daylight and warmth are apparent.
There is a moderate possibility that disturbances in the Polar Vortex may induce some cold in the eastern United States. Weather experts note that a “fairly large” disturbance in the vortex could be upon us, bringing frigid weather in mid-March. This could increase HDDs but other spring-like features are likely to take control as winter draws to a close.
From the EIA:
- Net withdrawals from storage totaled 60 Bcf for the week ending February 16, compared with the five-year (2019–2023) average net withdrawals of 168 Bcf and last year’s net withdrawals of 75 Bcf during the same week. Working natural gas stocks totaled 2,470 Bcf, which is 451 Bcf (22%) more than the five-year average and 265 Bcf (12%) more than last year at this time.
- According to The Desk survey of natural gas analysts, estimates of the weekly net change to working natural gas stocks ranged from net withdrawals of 51 Bcf to 88 Bcf, with a median estimate of 64 Bcf.