- Crude oil could top $100 per barrel
- Distillate fuel oil supplies remain tight
- Change in demand mix inhibits growth of distillate supply
- U.S. LNG exports continue to grow.

The Matrix
Petroleum prices moved higher last week. Product prices for the week ending September 15th moved modestly higher. Heating oil added 8.4 cents, settling at $3.3834. Gasoline, now trading the winter spec, recovered all of the value lost on the change to winter before moving to a weekly close at $2.7081.
WTI crude oil broke over $91 per barrel during the week, settling at $90.77 on Friday. Analysts have been projecting a one-hundred-dollar handle for crude oil this autumn. If serious shortages of ULSD inventories persist, a move above $100/bbl in crude oil will likely have an additional bullish impact on distillate prices.
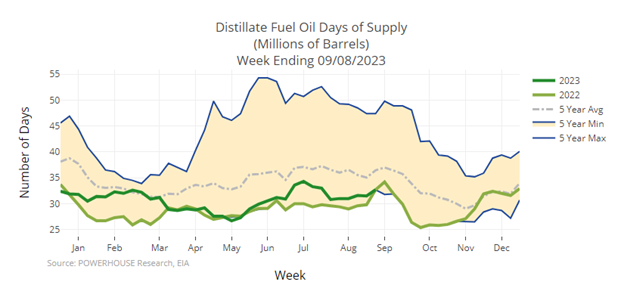
Distillate fuel supply now stands at 31 days, just at the low end of the five-year range. There are only 122.5 million barrels of distillate fuel oil in storage according to the U.S. Petroleum Balance Sheet for the week ending September 8, not far from the industry’s “minimum operating level.”
This is not only a domestic problem. Refiners globally are facing shortages and higher prices. Actions by OPEC+ to curtail production have affected refiners’ ability to produce distillate fuel oil.
Ironically, it is not only OPEC’s impact on the supply side of the equation that is creating the problem. Post-pandemic demand growth for jet fuel and gasoline has diverted feedstocks from diesel manufacture. As diesel is the fuel for over-the-road transportation and construction, a strong economy could compound the situation.
The strength of the world-wide economy is foremost in business thinking. Industrial production in China rose 4.5 percent – more than expected. But consumer sentiment in the United States fell, a bearish sign.
A change in international relations may be starting to emerge. Iran and Saudi Arabia exchanged ambassadors last week, a precursor to ending the Yemeni war. There is even some talk of a Saudi-Israeli rapprochement bringing more security to the Saudis from the United States. Calming the Middle East could create better conditions for regional oil production.
Supply/Demand Balances
Supply/demand data in the United States for the week ending September 08, 2023 were released by the Energy Information Administration.
Total commercial stocks of petroleum rose (⬆) 10.4 million barrels to 1.2656 billion barrels during the week ending September 08, 2023.
Commercial crude oil supplies in the United States were higher (⬆) by 4.0 million barrels from the previous report week to 420.6 million barrels.
Crude oil inventory changes by PAD District:
PADD 1: Up (⬆) 0.1 million barrels to 7.2 million barrels
PADD 2: Down (⬇) 4.2 million barrels to 104.7 million barrels
PADD 3: Up (⬆) 7.3 million barrels to 238.7 million barrels
PADD 4: Up (⬆) 0.3 million barrels to 24.0 million barrels
PADD 5: Up (⬆) 0.6 million barrels to 46.1 million barrels
Cushing, Oklahoma inventories were down (⬇) 2.4 million barrels from the previous report week to 25.0 million barrels.
Domestic crude oil production was up (⬆) 100,000 barrels at 12.9 million barrels daily.
Crude oil imports averaged 7.582 million barrels per day, a daily increase (⬆) of 812,000 barrels. Exports decreased (⬇) 1.842 million barrels daily to 3.090 million barrels per day.
Refineries used 93.7 percent of capacity; 0.6 percentage points higher (⬆) than the previous report week.
Crude oil inputs to refineries increased (⬆) 177,000 barrels daily; there were 16.8 million barrels per day of crude oil run to facilities. Gross inputs, which include blending stocks,increased (⬆) 110,000 barrels daily to 17.124 million barrels daily.
Total petroleum product inventories increased (⬆) by 6.4 million barrels from the previous report week, up to 845.0 million barrels.
Total product demand increased (⬆) 787,000 barrels daily to 20.991 million barrels per day.
Gasoline stocks increased (⬆) 5.6 million barrels from the previous report week; total stocks are 220.3 million barrels.
Demand for gasoline decreased (⬇) 1.014 million barrels per day to 8.307 million barrels per day.
Distillate fuel oil stocks increased (⬆) 3.9 million barrels from the previous report week; distillate stocks are at 122.5 million barrels. EIA reported national distillate demand at 3.578 million barrels per day during the report week, a decrease (⬇) of 288,000 barrels daily.
Propane stocks increased (⬆) by 3.1 million barrels from the previous report week to 99.1 million barrels. The report estimated current demand at 502,000 barrels per day, a decrease (⬇) of 487,000 barrels daily from the previous report week.
Natural Gas
Uncertainty surrounding the next move in natural gas continued last week. Prices for spot natural gas futures stayed around $2.64. Several times in recent weeks, we have observed that fundamentals do not seem to be affecting markets.
Warm weather should have been pushing demand for power generation higher, but EIA reported a small decline in generation demand. Offsetting gains in in industrial demand kept consumption unchanged. Intense heat in the southwest, and even unusual warmth along the East Coast were not enough to move prices. A modest decline in natural gas production was not reflected in prices either.
Nearby support for spot futures is found at $2.50 per MMBtu. Resistance is at $2.82. More significant resistance is at $3.02.
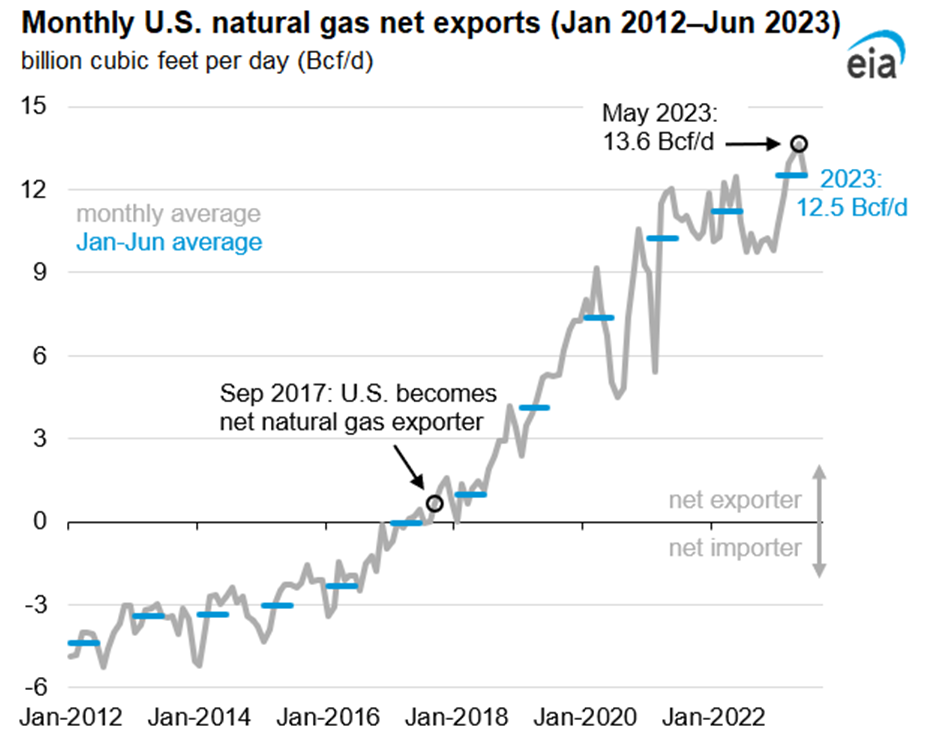
The question of future direction is being increasingly influenced by international economic and political events. One such event has been the net growth of U.S. exports. This has been discussed regularly here before, but the chart (below) of net exports since 2012, prepared by the U.S. EIA, paints a dramatic picture of the introduction of American natural gas to global markets.
The United States exported more natural gas in the first half of 2023 than in any similar period, a daily average of 12.5 Bcf. This was eleven percent higher (1.3 Bcf/d) than the same period in 2022. May 2023 recorded net exports 13.6 Bcf/d.
This is a remarkable result when we consider that the country became a net exporter as recently at 2017. Most of these exports reflected the start of LNG outflows from the Gulf Coast. (Sabine Pass LNG was the first facility online in 2016.) At the end of the first half of 2023, the United States was first among all LNG exporting countries.
And as the world relies more on American natural gas supplies, American natural gas supplies are going to affected by geopolitical actions from which they were historically insulated, including competition from the Middle East and Russian reaction to its own increasing isolation. U.S. natural gas managements should include global geopolitical expertise among its regular set of advisors.
Net injections into storage totaled 57 Bcf for the week ending September 8, compared with the five-year (2018–2022) average net injections of 76 Bcf and last year’s net injections of 74 Bcf during the same week. Working natural gas stocks totaled 3,205 Bcf, which is 203 Bcf (7%) more than the five-year average and 445 Bcf (16%) more than last year at this time. South Central region net injections rose for the first time since the July 14, 2023, report week.
SOURCE: EIA
According to The Desk survey of natural gas analysts, estimates of the weekly net change to working natural gas stocks ranged from net injections of 41 Bcf to 61 Bcf, with a median estimate of 53 Bcf.
The average rate of injections into storage is 6% lower than the five-year average so far in the refill season (April through October). If the rate of injections into storage matched the five-year average of 11.2 Bcf/d for the remainder of the refill season, the total inventory would be 3,798 Bcf on October 31, which is 203 Bcf higher than the five-year average of 3,595 Bcf for that time of year