- Production of crude oil over 13 million barrels daily
- Petroleum exports take eleven million barrels from U.S. stocks
- Distillate fuel oil stocks under pressure
- Natural gas supply exceeds long-term averages
The Matrix
Oil prices fell for the tenth week since September 25th, when WTI spot futures reached a high of $95.03. Last week, WTI fell to a $68.80 low before settling at $71.20.
The decline of $26.23 represented a loss of more than 28 percent of value over the period. It is not clear how underlying petroleum fundamentals or broader economic indicators might change the trajectory of prices.
U.S. production of crude oil continues to exceed 13 million barrels daily. This level could be nearly enough to support domestic refinery requirements, but demands for crude now include, importantly, export markets.
During the four weeks ending December 1, the United States exported 4.692 million barrels of crude oil daily. (We exported 6.364 million barrels per day of product too.) In all over eleven million barrels of hydrocarbons were sent out that could, in an emergency, be redirected to domestic uses.
Price bulls could be heartened by DOE’s renewed interest in refilling the Strategic Petroleum Reserve. After much delay, DOE has solicited to buy about 3 million barrels of replacement crude oil for March. A similar solicitation went out for February.

Distillate inventories remain a concern as winter begins. Inventories now stand at 112.045 million barrels. This is 11.6 percent below the average of the past five years.
We remain below 30 day’s supply of distillate fuel oil. Warmer weather could allow us to dodge a bullet this winter. But reliance on weather is a poor substitute for planning. Not surprisingly, exports of distillate fuel oil reached 1.2 million daily barrels last week.
Broader economic data tended to support the bulls. November payrolls additions reached 199,000, above expectations. Moreover, the unemployment rate fell to 3.7 percent, a four-month low. This was confirmed by an 8.1 gain in consumer sentiment, a four-month high of 69.4, and well above expectations.
Supply/Demand Balances
Supply/demand data in the United States for the week ending December 1, 2023 were released by the Energy Information Administration.
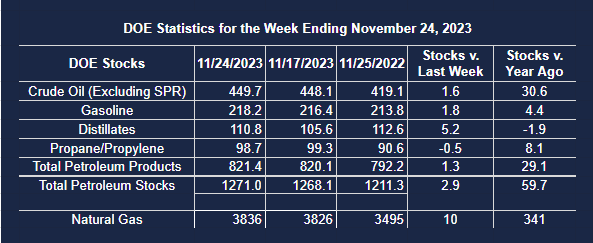
Total commercial stocks of petroleum down (⬇) 1.7 million barrels to 1.2693 billion barrels during the week ending December 1, 2023.
Commercial crude oil supplies in the United States were lower (⬇) by 4.6 million barrels from the previous report week to 445.0 million barrels.
Crude oil inventory changes by PAD District:
PADD 1: Down (⬇) 0.9 million barrels to 9.3 million barrels
PADD 2: Up (⬆) 1.2 million barrels to 110.7 million barrels
PADD 3: Down (⬇) 5.7 million barrels to 250.7 million barrels
PADD 4: Down (⬇) 0.2 million barrels to 24.4 million barrels
PADD 5: Up (⬆) 0.9 million barrels to 49.9 million barrels
Cushing, Oklahoma inventories were up (⬆) 1.9 million barrels from the previous report week to 29.6 million barrels.
Domestic crude oil production was down (⬇) 100,000 barrels at 13.1 million barrels daily.
Crude oil imports averaged 7.508 million barrels per day, a daily increase (⬆) of 1.675 million barrels. Exports decreased (⬇) 416,000 barrels daily to 4.339 million barrels per day.
Refineries used 90.5 percent of capacity; 0.7 percentage points higher (⬆) than the previous report week.
Crude oil inputs to refineries increased (⬆) 179,000 barrels daily; there were 16.201 million barrels per day of crude oil run to facilities. Gross inputs, which include blending stocks, increased (⬆) 121,000 barrels daily to 16.537 million barrels daily.
Total petroleum product inventories increased (⬆) by 3.0 million barrels from the previous report week, up to 824.3 million barrels.
Total product demand increased (⬆) 694,000 barrels daily to 19.611 million barrels per day.
Gasoline stocks increased (⬆) 5.4 million barrels from the previous report week; total stocks are 223.6 million barrels.
Demand for gasoline increased (⬆) 260,000 barrels per day to 8.466 million barrels per day.
Distillate fuel oil stocks increased (⬆) 1.3 million barrels from the previous report week; distillate stocks are at 112.0 million barrels. EIA reported national distillate demand at 3.756 million barrels per day during the report week, an increase (⬆) of 742,000 barrels daily.
Propane stocks decreased (⬇) by 1.8 million barrels from the previous report week to 97.0 million barrels. The report estimated current demand at 998,000 barrels per day, a decrease (⬇) of 217,000 barrels daily from the previous report week.
Natural Gas
An unusually large withdrawal of 117 Bcf of natural gas during the week ending December 1st was not unexpected. It was well within industry expectations, but the reduction in storage was not enough to move prices significantly.
Natural gas prices fell to $2.489 last week. This was as low as the market has seen since the week of July 31, when $2.457 was reached. The weakness reflects the effect of climate change and El Nino which have materially eroded Heating Degree Days compared with normal.
The Climate Prediction Center of NOAA reported that the nation generated 103 HDDs fewer than normal for the year since July, 2023. And in particularly important natural gas using regions, the shortfalls were even greater. New England recorded 166 fewer HDDs until December 1st, and the West North Central States fell 196 HDDs short for the period.
The challenge of more-than-adequate supply has been exacerbated by the storage situation in Japan and South Korea, two of the top three LNG importers globally. (China is the third.)
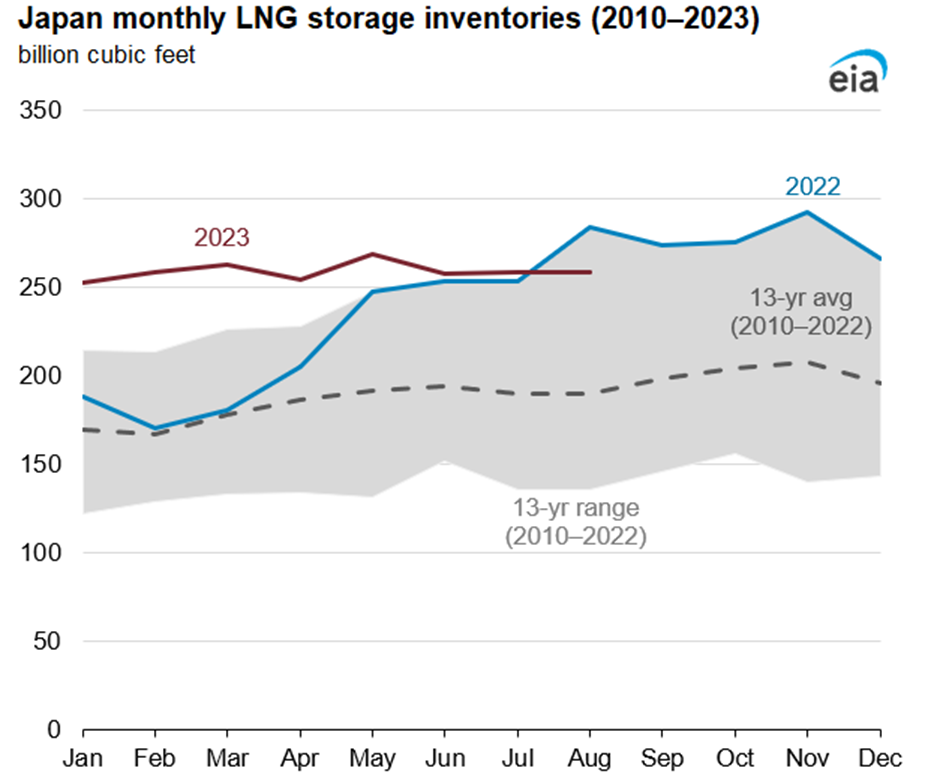
Source: Japan Ministry of Economy, Trade, and Industry, Japan Agency for Natural Resources and Energy
In both countries, LNG storage stood at or near all-time records as of last summer. Natural gas is stored above ground in regasification terminals in both places. This year, weather in Asia has been warmer than normal, as elsewhere. And last winter, this led to lower-than-normal imports of LNG.
So, the American spot futures market problem is really a global problem for supply and price. Powerhouse has reviewed the bearish prospects several times.
Underlying supply data are not encouraging for the bulls. EIA’s Short-Term Energy Outlook (STEO) estimates U.S. natural gas inventories are 3.7 Bcf, 7 percent more than the five-year average. STEO called for a $3.20 per MMBTU price in November, a price already well in the rear-view mirror. Friday’s close was $2.581. A critical low can be found at $1.946, from the week ending April 10, 2023.
According to the EIA:
- Net withdrawals from storage totaled 117 Bcf for the week ending December 1, compared with the five-year (2018–2022) average net withdrawals of 48 Bcf and last year’s net withdrawals of 30 Bcf during the same week. Working natural gas stocks totaled 3,719 Bcf, which is 234 Bcf (7%) more than the five-year average and 254 Bcf (7%) more than last year at this time.
- According to The Desk survey of natural gas analysts, estimates of the weekly net change to working natural gas stocks ranged from net withdrawals of 96 Bcf to 127 Bcf, with a median estimate of 106 Bcf.