- Petroleum prices fell last week
- Oil supply uncertain; Demand strong
- Economic data bullish
- Natural gas prices test support
The Matrix
Petroleum futures prices fell last week. This was consistent with a recovery in domestic crude oil production. DOE’s U.S. Petroleum Balance for the week ending January 26 reported output recovered to 13.0 million barrels daily from 12.3 million daily barrels during the prior week — a measure of how intense cold can interfere with oil flows.
The same weather effects probably explain the changes in total inventories which fell 9.6 million barrels daily for crude oil and petroleum products. A headline 5.3 million draw was reported for propane stocks.
A small increase in gasoline storage (+1.2 million barrels) reflected a sharp drop in refinery utilization. Refineries operated at 82.9 percent of capacity, compared with operations at 85.5 percent of capacity the week before. This worked out to a modest increase (+264,000 barrels per day) in consumption.
Inventories for crude oil and distillate fuel oil remain notably tight compared with average of the past five years. Crude oil supplies are 5.1 percent below the five-year average, and distillate fuel oil inventories lag that average by the same percentage. Gasoline in storage is 1.2 percent greater than the average of the past five years.
Total demand showed an improvement of 563,000 barrels per day during the week. Needs for propane (+404,000 daily barrels,) were especially notable.
The outlook for the U.S. economy has been especially strong as 2024 opens. Last month’s nonfarm payrolls added 353,00 new jobs, well above expectations of 185,000 more jobs. The January unemployment rate remained at 3.7 percent. Analysts forecast a 3.8 percent rate. Consumer Sentiment rose to an index of 79.0, a two and one-half year high.
A positive economic outlook and an uncertain supply situation should, arguably, translate into higher prices for goods and services. But that has not been the situation. Some suggest the explanation could be a cyclical reaction to the price explosions of 2022 and reactions from policy makers and markets. Now, signs of deflation are emerging, raising questions of whether Federal Reserve rate easing might be on the horizon.
Supply/Demand Balances
Supply/demand data in the United States for the week ending January 26, 2023 were released by the Energy Information Administration.
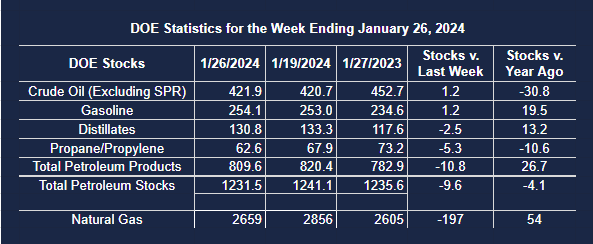
Total commercial stocks of petroleum fell (⬇) 9.6 million barrels to 1.2315 billion barrels during the week ending January 26, 2023.
Commercial crude oil supplies in the United States were higher (⬆) by 1.2 million barrels from the previous report week to 421.9 million barrels.
Crude oil inventory changes by PAD District:
PADD 1: Unchanged (=) at 7.6 million barrels
PADD 2: Down (⬇) 1.4 million barrels to 107.5 million barrels
PADD 3: Up (⬆) 3.1 million barrels to 235.1 million barrels
PADD 4: Up (⬆) 0.2 million barrels to 23.8 million barrels
PADD 5: Down (⬇) 0.7 million barrels to 47.8 million barrels
Cushing, Oklahoma inventories were down (⬇) 2.0 million barrels from the previous report week to 28.1 million barrels.
Domestic crude oil production was up (⬆) 700,000 barrels to 13.0 million barrels daily.
Crude oil imports averaged 5.605 million barrels per day, a daily increase (⬆) of 25,000 barrels. Exports decreased (⬇) 540,000 barrels daily to 3.894 million barrels per day.
Refineries used 82.9 percent of capacity; 2.6 percentage points lower (⬇) than the previous report week.
Crude oil inputs to refineries decreased (⬇) 428,000 barrels daily; there were 14.848 million barrels per day of crude oil run to facilities. Gross inputs, which include blending stocks, decreased (⬇) 478,000 barrels daily to 15.150 million barrels daily.
Total petroleum product inventories decreased (⬇) by 10.8 million barrels from the previous report week, down to 809.6 million barrels.
Total product demand increased (⬆) 563,000 barrels daily to 20.119 million barrels per day.
Gasoline stocks increased (⬆) 1.2 million barrels from the previous report week; total stocks are 254.1 million barrels.
Demand for gasoline increased (⬆) 264,000 barrels per day to 8.144 million barrels per day.
Distillate fuel oil stocks decreased (⬇) 2.5 million barrels from the previous report week; distillate stocks are at 130.8 million barrels. EIA reported national distillate demand at 3.757 million barrels per day during the report week, a decrease (⬇) of 26,000 barrels daily.
Propane stocks decreased (⬇) by 5.3 million barrels from the previous report week to 62.6 million barrels. The report estimated current demand at 1.931 million barrels per day, an increase (⬆) of 404,000 barrels daily from the previous report week.
Natural Gas
Spot natural gas futures prices flirted with the April 2023 low last week. They did not, however, break $2.00 support.
Prices remain under pressure following bearish market actions since the beginning of the year. Heating Degree Days have faltered, as we have covered for many weeks this winter. And the general warm pattern has not changed – especially in the eastern United States.
The fiscal year from July 1, 2023 showed New England with 87 more HDDs and the Middle Atlantic states, +41 HDDs.
Domestic supplies are likely to be augmented by natural gas supplies from the Freeport Texas LNG export terminal. One of the facility’s production trains is scheduled to be shut for a month. It is a casualty of extreme cold that afflicted Texas’ output recently. The loss of this unit will constrain U.S. LNG exports, pushing the gas on domestic markets.
According to the EIA:
- Net withdrawals from storage totaled 197 Bcf for the week ending January 26, compared with the five-year (2019–2023) average net withdrawals of 185 Bcf and last year’s net withdrawals of 141 Bcf during the same week. Net withdrawals from storage for the past two weeks combined were 523 Bcf. Working natural gas stocks totaled 2,659 Bcf, which is 130 Bcf (5%) more than the five-year average and 54 Bcf (2%) more than last year at this time.
- According to The Desk survey of natural gas analysts, estimates of the weekly net change to working natural gas stocks ranged from net withdrawals of 180 Bcf to 215 Bcf, with a median estimate of 203 Bcf.
- The average rate of withdrawals from storage is 5% higher than the five-year average so far in the withdrawal season (November through March). If the rate of withdrawals from storage matched the five-year average of 13.8 Bcf/d for the remainder of the withdrawal season, the total inventory would be 1,763 Bcf on March 31, which is 130 Bcf higher than the five-year average of 1,633 Bcf for that time of year.