- Petroleum inventories falling sharply
- Shale oil production falls after good recovery
- Demand is riding high
- Natural gas futures resist high-HDD rally.

The Matrix
Oil markets are pricing in possible inventory shortfalls and consequently higher prices for 2022.
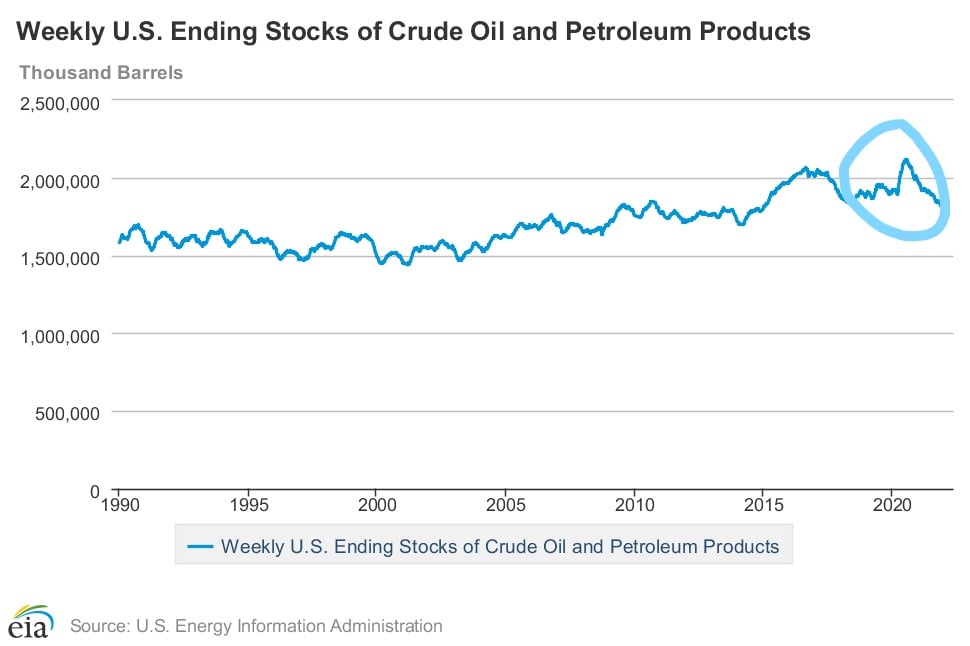
The chart of stocks of crude oil and petroleum products shows the dramatic decline in supply. Total supply (including the SPR) topped at 2.1 billion barrels in June of 2020. The latest data showed total supply at 1.8 trillion barrels. Covid-19’s onset led to sharp declines in demand and a corresponding ramp-up in supply. National economic and public health recoveries have reversed those trends.

The diesel futures price curve as well that of RBOB futures (once past the April contract) both exhibit significant backwardation. Backwardation is the condition when prompt-month contracts are more expensive than deferred contracts. Backwardation is a bullish sign. On Friday, the difference between the prompt and second month NYMEX diesel contracts reached levels not seen since 2015, and only seen five times in the contract’s 24-year history.
Contact POWERHOUSE for more on this important topic and the opportunities it could offer.
Supply/Demand Balances
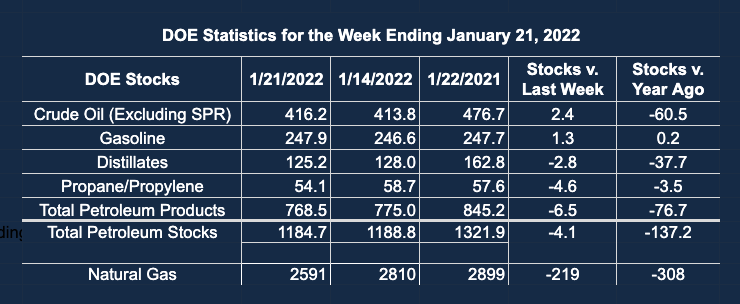
Supply/demand data in the United States for the week ending January 28, 2022 were released by the Energy Information Administration.
Total commercial stocks of petroleum fell 5.8 million barrels during the week ending January 28, 2022.
Commercial crude oil supplies in the United States decreased by 1.0 million barrels from the previous report week to 415.1 million barrels.
Crude oil inventory changes by PAD District:
PADD 1: Plus 1.2 million barrels to 8.1 million barrels
PADD 2: Down 0.8 million barrels to 112.3 million barrels
PADD 3: Down 2.7 million barrels to 222.2 million barrels
PADD 4: Plus 0.2 million barrels to 23.4 million barrels
PADD 5: Plus 0.9 million barrels to 49.9 million barrels
Cushing, Oklahoma inventories were down 1.2 million barrels from the previous report week to 30.5 million barrels.
Domestic crude oil production was down 100,000 per day from the previous report week at 11.5 million barrels daily.
Crude oil imports averaged 7.085 million barrels per day, a daily increase of 849,000 barrels. Exports decreased 420,000 barrels daily to 2.376 million barrels per day.
Refineries used 86.7 percent of capacity; 1.0 percentage points lower from the previous report week.
Crude oil inputs to refineries decreased 249,000 barrels daily; there were 15.248 million barrels per day of crude oil run to facilities. Gross inputs, which include blending stocks, fell 183,000 barrels daily to 15.714 million barrels daily.
Total petroleum product inventories fell 4.8 million barrels from the previous report week.
Gasoline stocks increased 2.1 from the previous report week; total stocks are 250.0 million barrels.
Demand for gasoline fell by 278,000 barrels per day to 8.226 million barrels per day.
Total product demand decreased 1.007 million barrels daily to 21.410 million barrels per day.
Distillate fuel oil stocks decreased 2.4 million barrels from the previous report week; distillate stocks are at 122.7 million barrels. EIA reported national distillate demand at 4.669 million barrels per day during the report week, a decrease of 85,000 barrels daily.
Propane stocks decreased 4.3 million barrels from the previous report week; propane stocks are at 49.8 million barrels. The report estimated current demand at 2.78 million barrels per day, a decrease of 278,000 barrels daily from the previous report week.
Natural Gas
Heating degree days (HDDs) for the week ending January 27, 2022, were dramatically higher than normal – and even more so when compared with last year. New England generated 318 HDDs for the week, 43 more than normal and 60 HDDs more than last year. The situation in the Middle Atlantic states was even more stark: the region saw 314 HDDs during the week, 51 HDDs more than usual and 68 more than last year at this time.
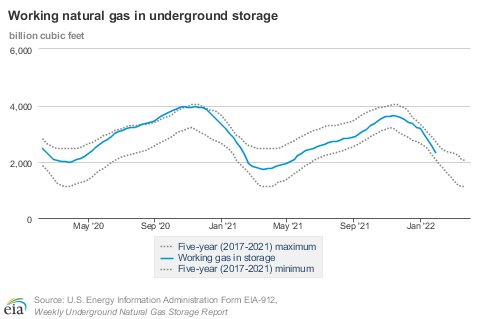
Underground storage of working natural gas fell, challenging the five-year (2017-2021) minimum.

The impact on natural gas futures prices was, ironically, a $0.33 loss for the week. (This followed the short squeeze discussed last week that elevated prices, perhaps excessively, with termination of the March futures contract.) Nonetheless, prices remain well above the end-of-2021 weekly low of $3.62.
According to the EIA:
The net withdrawals from storage totaled 268 Bcf for the week ending January 28, compared with the five-year (2017–2021) average net withdrawals of 150 Bcf and last year's net withdrawals of 183 Bcf during the same week. Working natural gas stocks totaled 2,323 Bcf, which is 143 Bcf lower than the five-year average and 393 Bcf lower than last year at this time.
The average rate of withdrawals from storage is 3% higher than the five-year average so far in the withdrawal season (November through March). If the rate of withdrawals from storage matched the five-year average of 12.9 Bcf/d for the remainder of the withdrawal season, the total inventory would be 1,523 Bcf on March 31, which is 143 Bcf lower than the five-year average of 1,666 Bcf for that time of year.
