- Petroleum product supplies fell ten million barrels
- Refinery challenges support Midwest prices
- Military aggression ratchets higher in Israel and Russia
- Natural gas futures break support at $2.00
The Matrix
Petroleum product prices appear to have bottomed for the season. This is consistent with historical seasonality and supported by the most recent U.S. Petroleum Balance Sheet, issued by the Department of Energy.
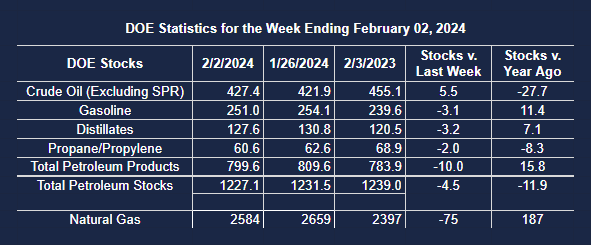
The report for the week ending February 2, 2024, was largely bullish for oil prices. Inventories of petroleum products fell by ten million barrels, offset in part by an increase in commercial crude oil stocks of 5.5 million barrels.
The decline in product supply was spread across principal products. Distillate fuel oil stocks lost 3.2 million barrels. Gasoline supply fell 3.1 million barrels. Inventories of propane dropped 2.6 million barrels.
The tightness was heightened by lower-performing refining facilities. Facilities showed no change in crude oil inputs but refinery utilization fell 0.5 percentage points for the report week.
Challenges in the Midwest were reflected in dramatic increases in area prices. BP’s Whiting refinery suffered unplanned downtime; local prices for both gasoline and distillates have added more than 20 cents since February began.
Heightened tensions in Gaza supported prices again last week. Air strikes at Rafah were taken as bullish by traders. One observer noted statements that “no part of the Gaza Strip would be immune from Israel’s offensive” could easily lead to the idea that markets may not yet have worked enough conflict-premium into prices, bullish for markets.
Ukraine has targeted two oil refineries in southern Russia. The Ilsky facility suffered a fire. The Afipsky refinery in Krasnodar was the other refinery under attack.
Oil factors in the United States have supported prices as has continuing aggressive behavior by Israel and Ukraine in Russia. Futures prices rallied through last week. New multi-month highs were seen for both products, gasoline and distillate fuel oil. There appears to be more runway ahead on the price charts. Major resistance for RBOB can be found at $2.72 (basis April,) and distillate fuel oil at $3.10 (basis front month futures.)
Supply/Demand Balances
Supply/demand data in the United States for the week ending February 2, 2024 were released by the Energy Information Administration.
Total commercial stocks of petroleum fell (⬇) 4.5 million barrels to 1.2271 billion barrels during the week ending February 2, 2024.
Commercial crude oil supplies in the United States were higher (⬆) by 5.5 million barrels from the previous report week to 427.4 million barrels.
Crude oil inventory changes by PAD District:
PADD 1: Down (⬇) 0.6 million barrels 7.0 million barrels
PADD 2: Up (⬆) 2.0 million barrels to 109.5 million barrels
PADD 3: Up (⬆) 6.3 million barrels to 241.4 million barrels
PADD 4: Up (⬆) 0.3 million barrels to 24.1 million barrels
PADD 5: Down (⬇) 2.3 million barrels to 45.5 million barrels
Cushing, Oklahoma inventories were unchanged (=) at 28.1 million barrels.
Domestic crude oil production was up (⬆) 300,000 barrels to 13.3 million barrels daily.
Crude oil imports averaged 6.907 million barrels per day, a daily increase (⬆) of 1.302 million barrels. Exports decreased (⬇) 298,000 barrels daily to 3.596 million barrels per day.
Refineries used 82.4 percent of capacity; 0.5 percentage points lower (⬇) than the previous report week.
Crude oil inputs to refineries decreased (⬇) 8,000 barrels daily; there were 14.840 million barrels per day of crude oil run to facilities. Gross inputs, which include blending stocks, decreased (⬇) 91,000 barrels daily to 15.059 million barrels daily.
Total petroleum product inventories decreased (⬇) by 9.9 million barrels from the previous report week, down to 799.7 million barrels.
Total product demand increased (⬆) 108,000 barrels daily to 20.227 million barrels per day.
Gasoline stocks decreased (⬇) 3.1 million barrels from the previous report week; total stocks are 251.0 million barrels.
Demand for gasoline increased (⬆) 663,000 barrels per day to 8.807 million barrels per day.
Distillate fuel oil stocks decreased (⬇) 3.2 million barrels from the previous report week; distillate stocks are at 127.6 million barrels. EIA reported national distillate demand at 3.817 million barrels per day during the report week, an increase (⬆) of 60,000 barrels daily.
Propane stocks decreased (⬇) by 2.0 million barrels from the previous report week to 60.6 million barrels. The report estimated current demand at 1.240 million barrels per day, a decrease (⬇) of 691,000 barrels daily from the previous report week.
Natural Gas
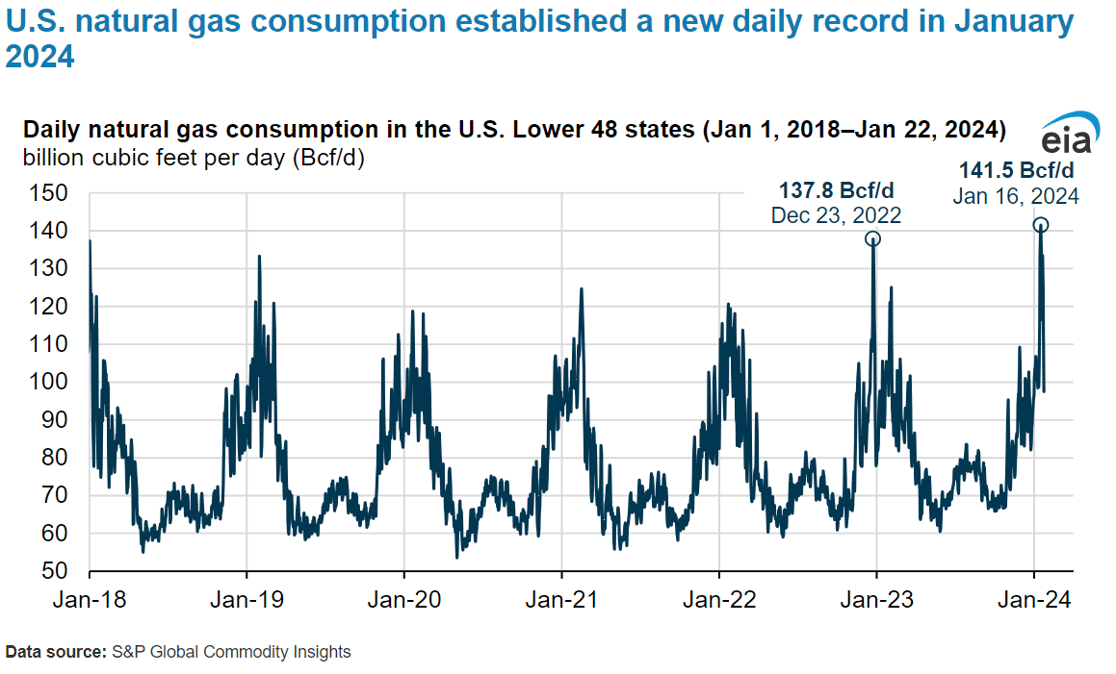
Much of the United States experienced very cold weather in late January. Natural gas demand reached a new daily high last month, reflecting a major incursion of cold Artic Air. On January 16, 2024 the U.S. recorded consumption of 141.5 Bcf/d. Temperatures, well below normal, inundated most of the lower 48 states, boosting use of methane to the highest daily level ever recorded. The previous record was set on December 23, 2022, when 137.8 Bcf/d were used.
The impact was seen in withdrawals from underground storage. Net withdrawals for the week of January 13 through January 19, reached 328 Bcf, third-highest for any week on record.
But prices for spot natural gas futures have not responded bullishly. The contrast between recent price history and price expectations based on growing production and already-adequate inventories is striking.
Prices broke through round-number support at $2.00 for spot Henry Hub futures last week, settling at $1.847. Inventories are elevated. Production continues to grow.
Elliot Wave analysis counts the current price move as a bearish Wave 5, the final leg of an impulsive wave pattern. Should a price bottom be established, an important technical confirmation could be the formation of bullish divergence on a momentum indicator such as the Relative Strength Index (RSI). Bullish divergence would exist if the current down move fails to match the oversold level reached in mid-December. This condition is not currently in place, but it merits close observation.
From the EIA:
- Net withdrawals from storage totaled 75 Bcf for the week ending February 2, compared with the five-year (2019–2023) average net withdrawals of 193 Bcf and last year’s net withdrawals of 208 Bcf during the same week. Working natural gas stocks totaled 2,584 Bcf, which is 248 Bcf (11%) more than the five-year average and 187 Bcf (8%) more than last year at this time.
- According to The Desk survey of natural gas analysts, estimates of the weekly net change to working natural gas stocks ranged from net withdrawals of 58 Bcf to 82 Bcf, with a median estimate of 75 Bcf.
- The average rate of withdrawals from storage is 5% lower than the five-year average so far in the withdrawal season (November through March.) If the rate of withdrawals from storage matched the five-year average of 12.1 Bcf/d for the remainder of the withdrawal season, the total inventory would be 1,881 Bcf on March 31, which is 248 Bcf higher than the five-year average of 1,633 Bcf for that time of year.