- Crude oil futures move over $80
- Price gains made on lower volume and open interest
- Supply of petroleum products fell
- Natural gas prices are plagued by too little heating demand
The Matrix
West Texas Intermediate (WTI) crude oil futures broke to new highs in their most recent advance. They reached $ 80.85 before settling just below $80. This was the continuation of a move that began in May 2023 at $63.67 and reached $95.03 last September. Price subsequently fell to $67.98 in December and has since advanced steadily.
Domestic inventories of crude oil added 4.2 million barrels during the week ending February 23. Half of that was in the Midwest, and 1.4 million barrels along the West Coast. This has relieved, but hardly erased, the national shortfall we are experiencing in crude oil supply. Supplies of crude oil are 33 million barrels below where they were last year at this time, with 16.8 million barrels fewer in Gulf Coast storage, and 12.4 million barrels less in the Midwest.
The price trend is higher, but the likelihood of any significant new high is unclear. The economy is at full employment but recent economic news is generally not price-supportive. The ISM manufacturing index fell in February, construction spending fell, and consumer sentiment has been revised downward. Price gains for WTI crude oil futures have occurred with lower volume and open interest since February 1.
Crude oil was by far the most bullish, supported by ongoing global tensions. Saudi Arabia confirmed it would not increase production and Russia announced further export reductions in 2024’s first quarter.
Inventory data were mixed. The U.S. Petroleum Balance Sheet for the week ending February 23 recorded supplies of petroleum products falling by 7.4 million barrels.
Distillate fuel oil stocks fell 500,00 barrels last week. The comparison with last year at this time shows distillate fuels inventories are now one million barrels lower with a particular focus on the East Coast, where nearly four million barrels of inventory were lost. Gains elsewhere offset much of the East Coast reduction. And this regional shortfall could be important because of its location in this population-rich area. Put another way, distillate fuel oils inventories are 9.7 percent lower than the average of the past five years.
Gasoline supplies fell by 2.8 million barrels during the report week. They are 2.6 percent below the comparable five-year average inventory level. Tightness in supply supports price, and last week was no exception.
March 1 was the first day on which summer-grade gasoline futures (basis April) were traded as front-month. A new marginal high of $2.6380 per gallon was recorded. This price sets the first resistance in the rally now unfolding, slightly above the market’s current value. Resistance is at $2.73 basis April futures. The resistance is at $2.9860 on a continuation chart.
Supply/Demand Balances
upply/demand data in the United States for the week ending February 23, 2024 were released by the Energy Information Administration.
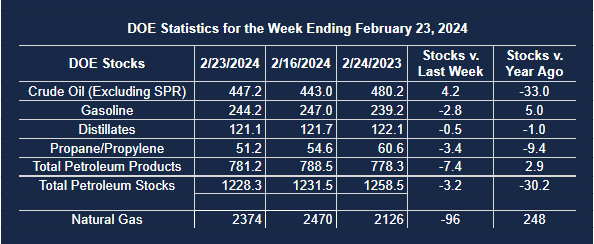
Total commercial stocks of petroleum fell (⬇) 3.2 million barrels to 1.2283 billion barrels during the week ending February 23, 2024.
Commercial crude oil supplies in the United States were higher (⬆) by 4.2 million barrels from the previous report week to 447.2 million barrels.
Crude oil inventory changes by PAD District:
PADD 1: Down (⬇) 0.3 million barrels 7.5 million barrels
PADD 2: Up (⬆) 2.1 million barrels to 116.2 million barrels
PADD 3: Up (⬆) 0.1 million barrels to 250.4 million barrels
PADD 4: Up (⬆) 0.2 million barrels to 24.8 million barrels
PADD 5: Down (⬇) 0.6 million barrels to 46.2 million barrels
Cushing, Oklahoma inventories were up (⬆) 1.5 million barrels at 31.0 million barrels.
Domestic crude oil production was unchanged (=) at 13.3 million barrels daily.
Crude oil imports averaged 6.385 million barrels per day, a daily decrease (⬇) of 269,000 barrels. Exports decreased (⬇) 237,000 barrels daily to 4.728 million barrels per day.
Refineries used 81.5 percent of capacity; unchanged (=) from the previous report week.
Crude oil inputs to refineries increased (⬆) 100,000 barrels daily; there were 14.674 million barrels per day of crude oil run to facilities. Gross inputs, which include blending stocks, increased (⬆) 177,000 barrels daily to 14.957 million barrels daily.
Total petroleum product inventories decreased (⬇) by 7.4 million barrels from the previous report week, down to 781.1 million barrels.
Total product demand decreased (⬇) 610,000 barrels daily to 19.529 million barrels per day.
Gasoline stocks decreased (⬇) 2.8 million barrels from the previous report week; total stocks are 244.2 million barrels.
Demand for gasoline increased (⬆) 267,000 barrels per day to 8.467 million barrels per day.
Distillate fuel oil stocks decreased (⬇) 0.5 million barrels from the previous report week; distillate stocks are at 121.1 million barrels. EIA reported national distillate demand at 3.536 million barrels per day during the report week, a decrease (⬇) of 404,000 barrels daily.
Propane stocks decreased (⬇) by 3. million barrels from the previous report week to 54.6 million barrels. The report estimated current demand at 1.030 million barrels per day, a decrease (⬇) of 303,000 barrels daily from the previous report week.
Natural Gas
Front-month natural gas futures prices fell to $1.60 late last month. A rally on low volume and declining open interest has followed but has not been able to sustain strength. The move reflects short covering, not new buyers. Even at these prices, the question of a bottom is not clear.
Department of Energy advised traders that the Henry Hub daily natural gas cash price reached a record low at $1.50 (inflation-adjusted) in February.
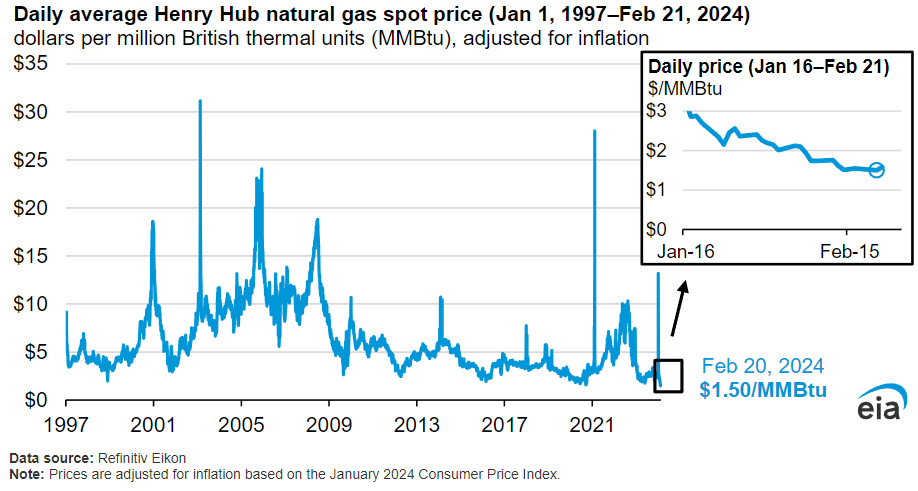
The U.S. benchmark Henry Hub daily natural gas price averaged $1.50 per million British thermal units (MMBtu) on February 20, 2024, the lowest price in inflation-adjusted dollars since at least 1997, according to data from Refinitiv Eikon.
According to the EIA: “High natural gas production, low natural gas consumption, and higher natural gas inventories than the previous five-year (2018–22) average contributed to prices declining for much of 2023.”
Natural gas production in the United States had been rising through 2023. In December, output reached 105.7 Bcf daily. This was a record high. But consumption has fallen, especially in the residential and commercial sectors. (The failure to generate HDDs has been well documented by Powerhouse in recent months.) EIA notes that consumption in the residential; and commercial sectors was about 5 percent lower than the average of the past five years (2019-2023.)
Underground storage has been more abundant than normal as a result. Withdrawals from storage have been 18 percent lower than the five-year average this year. At current rates this year, the country could wind up with 2.1 Tcf in storage, nearly 500 Bcf more than the average of the past five years.
Globally, natural gas availability could expand as Qatar expands its LNG offerings to Asia. This comes at a time the Untied States is establishing itself as a major global provider of LNG. Analysts project Qatar could control as much as one-quarter of the market by 2030.
From the EIA:
- The net withdrawals from storage totaled 96 Bcf for the week ending February 23, compared with the five-year (2019–2023) average net withdrawals of 143 Bcf and last year’s net withdrawals of 79 Bcf during the same week. Working natural gas stocks totaled 2,374 Bcf, which is 498 Bcf (27%) more than the five-year average and 248 Bcf (12%) more than last year at this time.
- According to The Desk survey of natural gas analysts, estimates of the weekly net change to working natural gas stocks ranged from net withdrawals of 78 Bcf to 96 Bcf, with a median estimate of 86 Bcf.
- The average rate of withdrawals from storage is 18% lower than the five-year average so far in the withdrawal season (November through March). If the rate of withdrawals from storage matched the five-year average of 6.6 Bcf/d for the remainder of the withdrawal season, the total inventory would be 2,131 Bcf on March 31, which is 498 Bcf higher than the five-year average of 1,633 Bcf for that time of year.