- Iran seeks to cool regional tensions
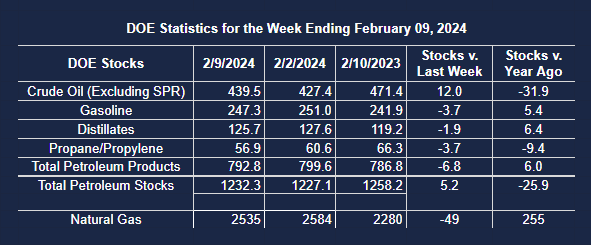
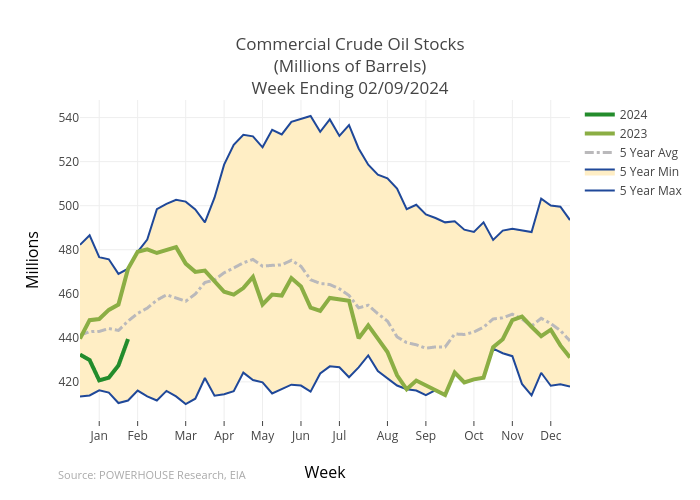
- Crude oil supply in the U.S. grows by 12 million barrels
- Warm sea surface temperatures suggest an active hurricane season
- Natural gas inventories above average
The Matrox
The week ending February 16 began with storm-induced strength, but prices did not follow through. Gasoline had the most bullish showing, but even there, prices were only modestly higher at week’s end.
A contest between bearish inventory statistics and tension-laden military action in Israel and elsewhere in the Middle East brought the market to a quiet close. Ironically, post-close, Iran was reportedly urging militant groups in the Middle East that it supports financially to restrain from escalating military activity against American forces in the region.
The intricacies of Middle East political affairs are complex at any time. Now, the attack by Hamas on October 7 against Israel has accelerated the situation. Iran appears concerned that further escalation could lead to a wider regional war.
Successes touted by Iran would be in jeopardy. These include complicating efforts at normalizing relations between Saudi Arabia and Israel. Moreover, Iraq values the presence of American troops as a counterbalance to what remains of the Islamic State. Iran has been pushing for an American withdrawal from Iraq; this seems now to be on hold.
The U.S. Petroleum Balance Sheet for the week ending February 9 was largely bearish for markets. Crude oil added 12 million barrels to commercial inventories.
Petroleum products added 6.8 million barrels to supply. Gasoline and propane had increases in supply of 3.7 million barrels each, and distillate fuel oils gained 1.9 million barrels.
The increase in the supply of propane and distillate fuel oils reflects ongoing El Nino-induced warmth. The Climate Prediction Center reported that, for the week ending February 8, the country lagged normal HDD production by 45 degrees. Regionally, the West North Central states generated 123 fewer HDDs than normal.
NOAA calls for El Nino to keep temperatures warm through March, probably adding to inventories of heating fuels. Our attention will turn to summer and Hurricane Season, traditionally beginning on June 1. Meteorologists expect that El Nino will be replaced by a La Nina event.
La Nina is consistent with an active hurricane season. Current sea surface temperatures are well above normal in the Atlantic Ocean main development region and 1.1⁰ Fahrenheit “higher than any other year on record.” This is a recipe for more intense hurricanes this summer.

Ocean temperatures in 2024 over the Main Development Region of the tropical Atlantic compared with other years. This region is where intense hurricanes are known to form, particularly in the late summer and early fall.
Supply/Demand Balances
Supply/demand data in the United States for the week ending February 9, 2024 were released by the Energy Information Administration.
Total commercial stocks of petroleum rose (⬆) 5.2 million barrels to 1.2323 billion barrels during the week ending February 9, 2024.
Commercial crude oil supplies in the United States were higher (⬆) by 12.0 million barrels from the previous report week to 439.4 million barrels.
Crude oil inventory changes by PAD District:
PADD 1: Up (⬆) 0.7 million barrels 7.7 million barrels
PADD 2: Up (⬆) 2.8 million barrels to 112.3 million barrels
PADD 3: Up (⬆) 6.9 million barrels to 248.3 million barrels
PADD 4: Up (⬆) 0.2 million barrels to 24.3 million barrels
PADD 5: Up (⬆) 1.4 million barrels to 46.9 million barrels
Cushing, Oklahoma inventories were up (⬆) 0.7 million barrels at 28.8 million barrels.
Domestic crude oil production was unchanged (=) at 13.3 million barrels daily.
Crude oil imports averaged 6.470 million barrels per day, a daily decrease (⬇) of 437,000 barrels. Exports increased (⬆) 751,000 barrels daily to 4.347 million barrels per day.
Refineries used 80.6 percent of capacity; 1.8 percentage points lower (⬇) than the previous report week.
Crude oil inputs to refineries decreased (⬇) 298,000 barrels daily; there were 14.542 million barrels per day of crude oil run to facilities. Gross inputs, which include blending stocks, decreased (⬇) 281,000 barrels daily to 14.778 million barrels daily.
Total petroleum product inventories decreased (⬇) by 6.8 million barrels from the previous report week, down to 792.9 million barrels.
Total product demand decreased (⬇) 973,000 barrels daily to 19.225 million barrels per day.
Gasoline stocks decreased (⬇) 3.7 million barrels from the previous report week; total stocks are 247.3 million barrels.
Demand for gasoline decreased (⬇) 639,000 barrels per day to 8.168 million barrels per day.
Distillate fuel oil stocks decreased (⬇) 1.9 million barrels from the previous report week; distillate stocks are at 125.7 million barrels. EIA reported national distillate demand at 3.514 million barrels per day during the report week, a decrease (⬇) of 303,000 barrels daily.
Propane stocks decreased (⬇) by 3.7 million barrels from the previous report week to 56.9 million barrels. The report estimated current demand at 1.333 million barrels per day, an increase (⬆) of 93,000 barrels daily from the previous report week.
Natural Gas
Front-month natural gas Henry Hub futures prices fell for the sixth consecutive week. The price fell to $1.575, a decline from $2.863 reached at the beginning of the year. Spot prices reached $3.643 late last November.
Last week’s unremitting selling pressure drove the Relative Strength Index (RSI) into deeply oversold territory. After light trading volume on the President’s Day holiday and choppy action on Tuesday, the market was greeted by the news that a major U.S. shale gas driller planned to significantly cut back on its production. The current market bounce has lifted the RSI out of oversold territory, and it will be important to watch for any signs of ‘weak shorts’ covering their positions.
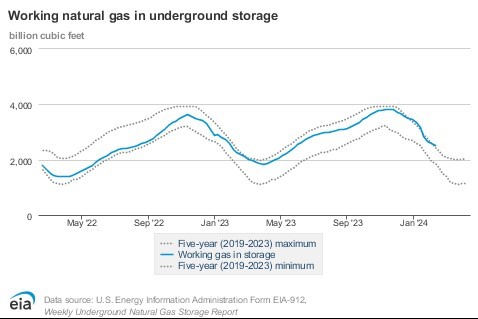
The most recent natural gas report from EIA showed underground storage of natural gas at 2.5 Tcf, a withdrawal of 49 Bcf for the week ending February 9. This reduction in storage was below expectations by the market of 65 Bcf. The reduction was well below the average of the past five years (149 Bcf) and last year’s 117 Bcf withdrawal for the same week.
Natural gas inventories have been held well above recent averages, 15.9 percent above the five-year average, and 11.9 percent year-on-year for the comparable week. This points toward a relatively robust situation as the withdrawal period ends on March 31. EIA suggests nearly two Tcf could remain as the winter ends.
NOAAs Climate Prediction Center estimates a 55 percent likelihood that the El Nino will remain in effect through the end of March. This should be bearish for natural gas prices, limiting snow cover across Canada.
EIA has estimated that the role of natural gas in capacity additions to electric power generation may be diminishing. Its place is likely to be conceded to solar and battery storage which are set to provide 81 percent of new electric generation in 2024.
There are likely to be 2.5 GW in capacity additions, the lowest new capacity in 25 years. Most of the new natural gas-fired capacity will come from simple-cycle gas turbine plants. These are attractive for their ability to start up, ramp up, and shut down quickly.
From the EIA:
- Net withdrawals from storage totaled 49 Bcf for the week ending February 9, compared with the five-year (2019–2023) average net withdrawals of 149 Bcf and last year’s net withdrawals of 117 Bcf during the same week. Working natural gas stocks totaled 2,535 Bcf, which is 348 Bcf (16%) more than the five-year average and 255 Bcf (11%) more than last year at this time.
- According to The Desk survey of natural gas analysts, estimates of the weekly net change to working natural gas stocks ranged from net withdrawals of 48 Bcf to 82 Bcf, with a median estimate of 65 Bcf.
- The average rate of withdrawals from storage is 12% lower than the five-year average so far in the withdrawal season (November through March). If the rate of withdrawals from storage matched the five-year average of 10.9 Bcf/d for the remainder of the withdrawal season, the total inventory would be 1,981 Bcf on March 31, which is 348 Bcf higher than the five-year average of 1,633 Bcf for that time of year, a surplus of nearly 12 percent.