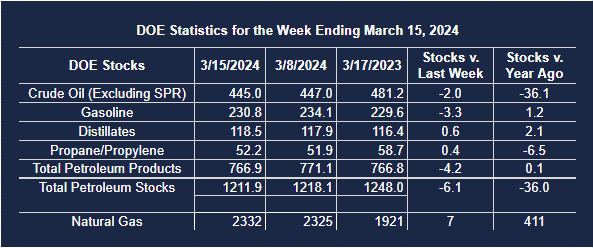
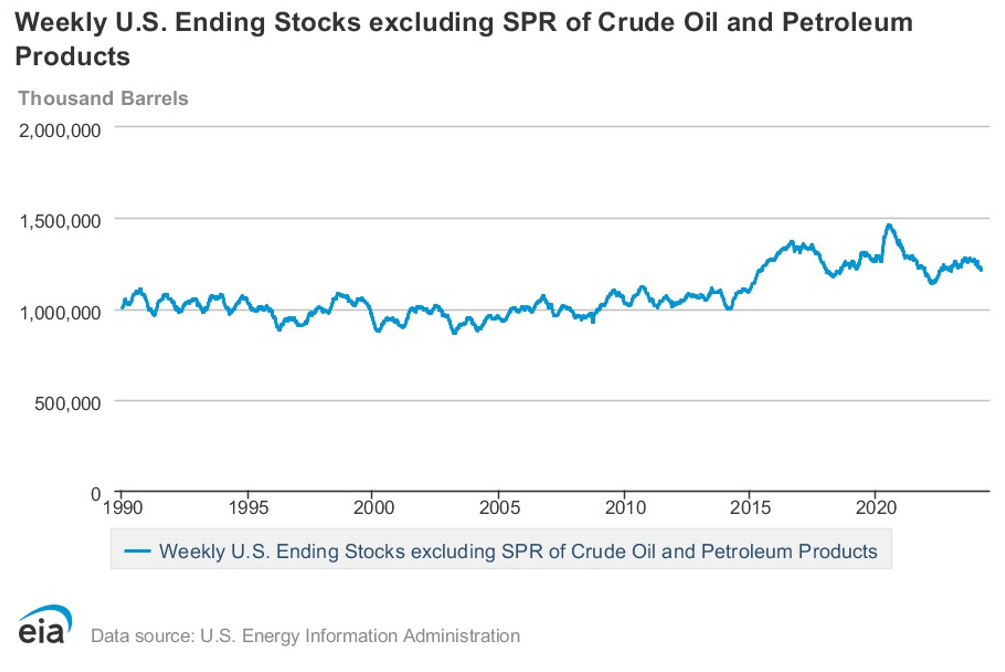
- Total U.S. petroleum stocks fell by 6.1 million barrels
- Higher exports offset higher refinery run rates
- Technical price patterns may be shifting
- Natural gas prices could be pressured lower
The Matrix
The Energy Information Administration issued the U.S. Petroleum Balance Sheet for the Week Ending March 15, 2024, last week. Inventories of crude oil and petroleum products continued to fall. Crude oil stocks lost two million barrels, and petroleum product stocks fell by 4.1 million barrels.
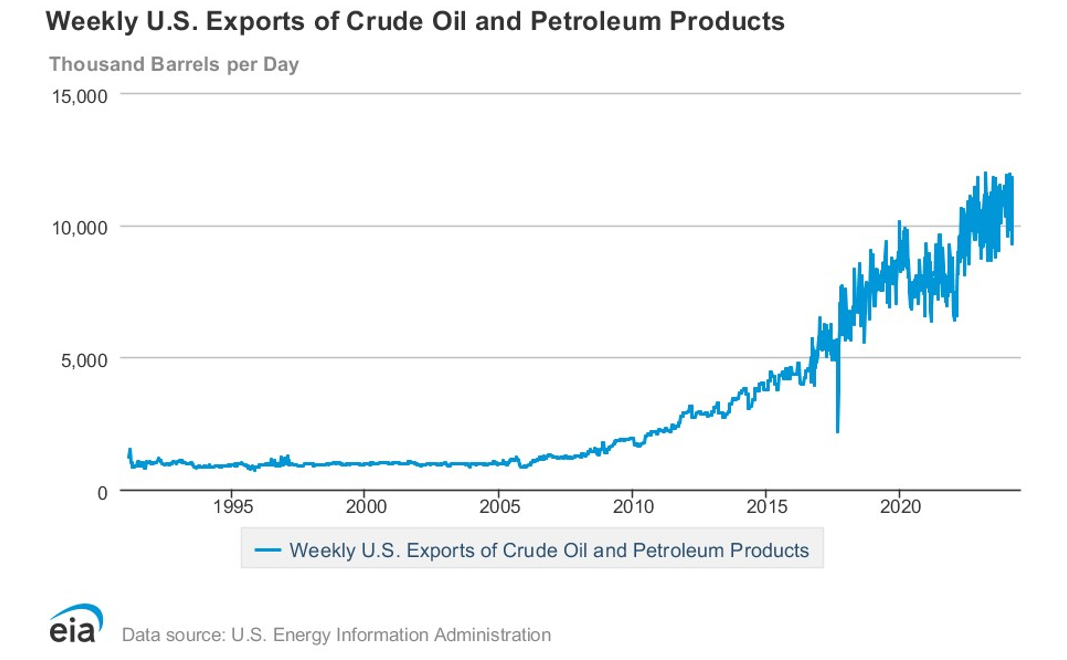
A one-percentage-point increase in refinery use to 87.8 percent and a 120,000 barrels daily gain in crude oil inputs to refineries were accompanied by a 1.1 million barrels per day cut in product demand. These should have allowed for a recovery in domestic inventories. A hefty 1.734 million barrels daily increase in weekly exports of crude oil added to exports of 766,000 petroleum product barrels to more-than-offset refiner’s ability to build storage.
The increase in exports reflects the country’s heightened ability to expand production through shale oil technology and a global market receptive to American oil because of limitations imposed on Russian supplies to Western Europe and OPEC+ self-imposed quotas on crude oil exports (however ineffective these may be).
The heating season is drawing to an end, and the near-term future for distillate prices should be determined by the demand for diesel fuel for use on the roads. The Petroleum Balance Sheet showed that the demand for distillate fuel oil was at 3.8 million barrels during the report week ending March 15, which is not unusual for this time of year.
ULSD has been moving higher since December 13, when spot futures bottomed at $2.4828. Prices nearly reached $3.00 in February and then fell back, trading in a range since then. ULSD settled at $2.6855 last Friday. Volatility in ULSD pricing continues to remain low. Bollinger Bands are a widely used technical measure. In the graphic below, the constricting Bollinger Bands illustrate diminishing price volatility. As can also be seen in the chart, volatility fluctuates dramatically. The current ‘quiet’ period bears watching.
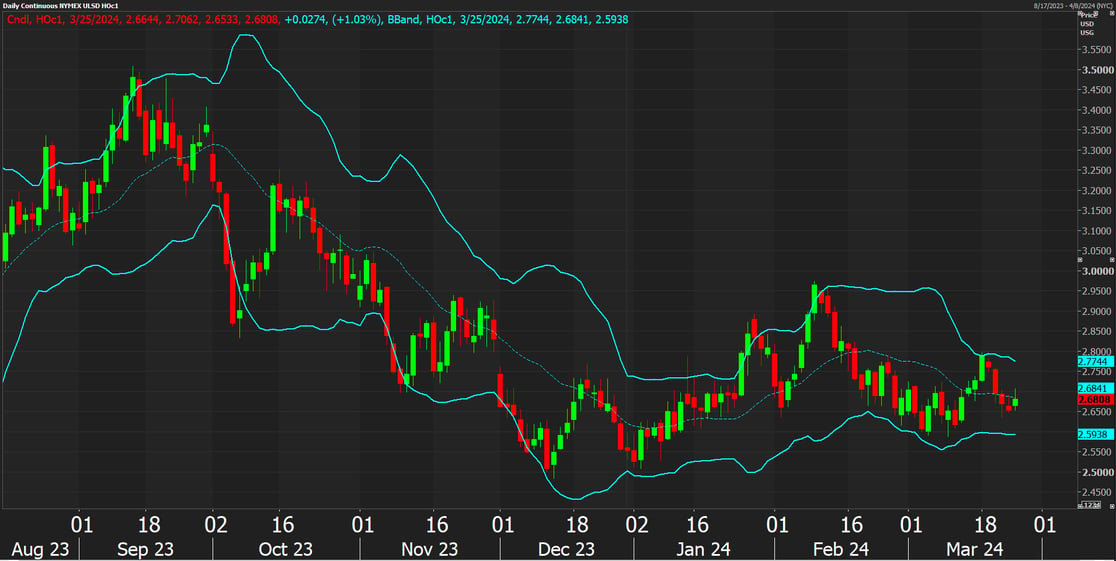
Inventories are slim. Demand for ULSD is normal for this time of year. Employment remains robust. Interest rates are likely to fall soon. Data on volume and open interest in futures markets do not suggest any serious length accumulation. A gain in volatility could indicate a new leg higher in ULSD prices.
Supply/Demand Balances
Supply/demand data in the United States for the week ending March 15, 2024 were released by the Energy Information Administration.
Total commercial stocks of petroleum fell (⬇) 6.1 million barrels to 1.2119 billion barrels during the week ending March 15, 2024.
Commercial crude oil supplies in the United States were lower (⬇) by 2.0 million barrels from the previous report week to 445.0 million barrels.
Crude oil inventory changes by PAD District:
PADD 1: Up (⬆) 0.2 million barrels at 8.3 million barrels
PADD 2: Down (⬇) 0.6 million barrels to 116.7 million barrels
PADD 3: Down (⬇) 0.7 million barrels to 247.9 million barrels
PADD 4: Up (⬆) 0.5 million barrels at 26.3 million barrels
PADD 5: Down (⬇) 1.2 million barrels to 45.9 million barrels
Cushing, Oklahoma inventories were down (⬇) 0.1 million barrels from the previous report week to 31.4 million barrels.
Domestic crude oil production was unchanged (=) at 13.1 million barrels daily.
Crude oil imports averaged 6.278 million barrels per day, a daily increase (⬆) of 787,000 barrels. Exports increased (⬆) 1.734 million barrels daily to 4.881 million barrels per day.
Refineries used 87.8 percent of capacity; 1.0 percentage points higher (⬆) than the previous report week.
Crude oil inputs to refineries increased (⬆) 127,000 barrels daily; there were 15.785 million barrels per day of crude oil run to facilities. Gross inputs, which include blending stocks, increased (⬆) 179,000 barrels daily to 16.102 million barrels daily.
Total petroleum product inventories decreased (⬇) by 4.2 million barrels from the previous report week, up to 766.9 million barrels.
Total product demand decreased (⬇) 1.061 million barrels daily to 19.742 million barrels per day.
Gasoline stocks decreased (⬇) 3.3 million barrels from the previous report week; total stocks are 230.8 million barrels.
Demand for gasoline decreased (⬇) 235,000 barrels per day to 8.809 million barrels per day.
Distillate fuel oil stocks increased (⬆) 0.6 million barrels from the previous report week; distillate stocks are at 118.5 million barrels. EIA reported national distillate demand at 3.786 million barrels per day during the report week, an increase (⬆) of 411,000 barrels daily.
Propane stocks increased (⬆) by 0.4 million barrels from the previous report week to 52.2 million barrels. The report estimated current demand at 909,000 barrels per day, a decrease (⬇) of 327,000 barrels daily from the previous report week.
Natural Gas
Natural gas spot futures prices traded “inside “for the week ending March 22. The week’s price high was lower, and the low was higher than the week before, adding little to our understanding of the price direction to come.
With winter HDDs abating, the incentives for new buying appear to be limited for natural gas in the next few weeks. Weather, surplus gas in storage, and constraints on new export volumes of LNG are limiting moves higher. Prices are trading near a three-and-one-half-year low. They have moved lower since last November, with little in the way of a relief rally. Even open interest has been declining slightly since the beginning of the year, suggesting little appetite for the price to sink even lower. The Climate Prediction Center of NOAA offers a prediction the current El Nino weather event will remain in place through at least March. This could apply further pressure on natural gas prices.
The Federal government has introduced further uncertainty into natural gas price projections. A pause on new export terminal licenses was imposed in January of this year. Its impact on domestic supply is unclear because of the current strong natural gas production and licenses issued before the moratorium was imposed. The U.S. has become an important provider to France and Germany’s gas demand. Even with the current limits, analysts believe there is enough available from current output to meet their demands.
Freeport Texas LNG export facilities have added more to the bear side of the price equation. Powerhouse has reported on the shutdown of one train reflecting cold weather damage. That unit has been partially reopened, but the other two units will be shut for maintenance and repair and will not be reopened until May.
According to the EIA:
- Net injections into storage totaled 7 Bcf for the week ending March 15, compared with the five-year (2019–2023) average net withdrawals of 42 Bcf and last year’s net withdrawals of 68 Bcf during the same week. Working natural gas stocks totaled 2,332 Bcf, which is 678 Bcf (41%) more than the five-year average, 411 Bcf (21%) more than last year at this time, and 306 Bcf (15%) more than the five-year maximum.
- According to The Desk survey of natural gas analysts, estimates of the weekly net change to working natural gas stocks ranged from net withdrawals of 6 Bcf to net injections of 17 Bcf, with a median estimate of net injections of 3 Bcf.
- The average rate of withdrawals from storage is 26% lower than the five-year average so far in the withdrawal season (November through March). If the rate of withdrawals from storage matched the five-year average of 1.3 Bcf/d for the remainder of the withdrawal season, the total inventory would be 2,311 Bcf on March 31, which is 678 Bcf higher than the five-year average of 1,633 Bcf for that time of year.