- U.S. crude oil and gasoline inventory levels lose barrels
- Alternative sources of supply under pressure
- The U.S. is a net exporter of petroleum products
- Intense heat limits accumulation of natural gas in storage.
The Matrix
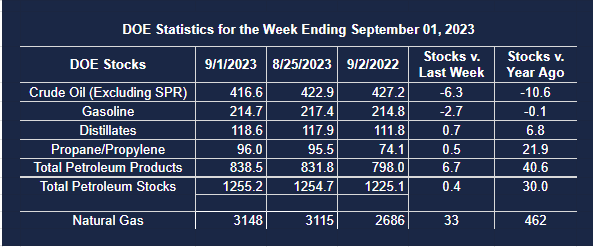
Product prices ended the week of September 8 on a bullish note. The rally probably reflected bullish inventory data from the Department of Energy. Commercial stocks of crude oil fell 6.3 million barrels in the Department’s weekly supply balance report, well above industry expectations. Gasoline stocks drew 2.7 million barrels.
These losses have added to concerns that oil supply may be falling to a level that could threaten national security – especially now that the Strategic Petroleum Reserve has only 350 million barrels. The SPR itself is seeking new supply to replace crude oil taken to keep gasoline prices low last year. Supplies of crude oil lag the average of the past five years by four percent.
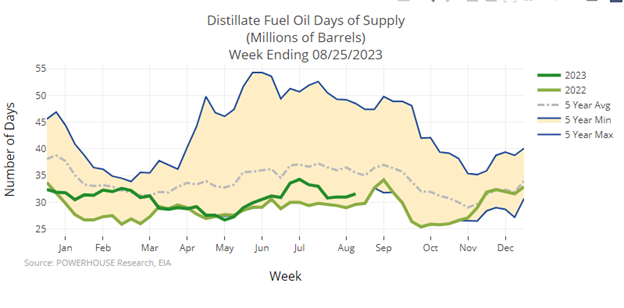
Stocks of gasoline and distillate fuel oil lag five, and fourteen percent respectively. The chart of distillate fuel oil days of supply is particularly troublesome. The United States has less than thirty days supply of distillate fuels on hand as autumn begins.
An El Nino weather pattern has been predicted, bringing colder weather. A break above previous resistance at $3.31 could invite even higher prices, with a four-handle a distinct possibility.
New supply may be hard to come by. Refineries have been operating over 90 percent of capacity for much of the year, and will, at some point, need to plan for maintenance. And the United States has become a global supplier of product.
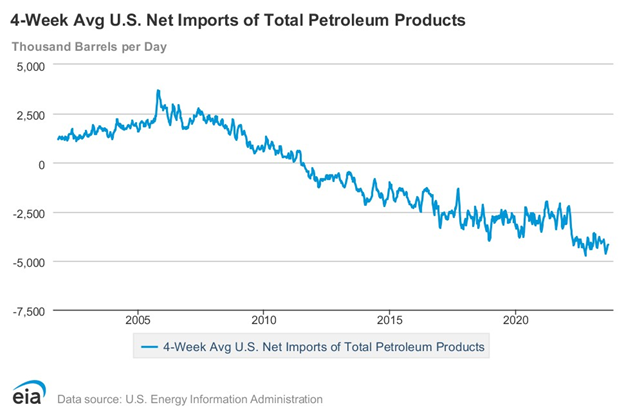
Domestic net imports of total petroleum products have been falling since 2005, when 3.250 million net barrels daily were imported. This number has fallen steadily since then. The four weeks ending September 1, 2023, saw the United States export 4.2 million barrels per day of petroleum products.
Moreover, OPEC+ has been remarkably disciplined, keeping more than two million barrels of crude oil off the market since November, 2022.
Supply/Demand Balances
Supply/demand data in the United States for the week ending September 01, 2023 were released by the Energy Information Administration.
Total commercial stocks of petroleum rose (⬆) 0.4 million barrels to 1.2552 billion barrels during the week ending September 01, 2023.
Commercial crude oil supplies in the United States were lower (⬇) by 6.3 million barrels from the previous report week to 416.6 million barrels.
Crude oil inventory changes by PAD District:
PADD 1: Up (⬆) 0.4 million barrels to 7.1 million barrels
PADD 2: Down (⬇) 2.4 million barrels to 108.9 million barrels
PADD 3: Down (⬇) 2.9 million barrels to 231.4 million barrels
PADD 4: Unchanged (=) at 23.7 million barrels
PADD 5: Down (⬇) 1.4 million barrels to 45.5 million barrels
Cushing, Oklahoma inventories were down (⬇) 1.8 million barrels from the previous report week to 27.4 million barrels.
Domestic crude oil production was unchanged (=) at 12.8 million barrels daily.
Crude oil imports averaged 6.770 million barrels per day, a daily increase (⬆) of 154,000 barrels. Exports increased (⬆) 404,000 barrels daily to 4.932 million barrels per day.
Refineries used 93.1 percent of capacity; 0.2 percentage points lower (⬇) than the previous report week.
Crude oil inputs to refineries decreased (⬇) 20,000 barrels daily; there were 16.623 million barrels per day of crude oil run to facilities. Gross inputs, which include blending stocks,decreased (⬇) 27,000 barrels daily to 17.014 million barrels daily.
Total petroleum product inventories increased (⬆) by 6.8 million barrels from the previous report week, up to 838.6 million barrels.
Total product demand decreased (⬇) 1.226 million barrels daily to 20.203 million barrels per day.
Gasoline stocks decreased (⬇) 2.7 million barrels from the previous report week; total stocks are 214.7 million barrels.
Demand for gasoline increased (⬆) 253,000 barrels per day to 9.321 million barrels per day.
Distillate fuel oil stocks increased (⬆) 0.7 million barrels from the previous report week; distillate stocks are at 118.6 million barrels. EIA reported national distillate demand at 3.866 million barrels per day during the report week, an increase (⬆) of 164,000 barrels daily.
Propane stocks increased (⬆) by 0.5 million barrels from the previous report week to 96.0 million barrels. The report estimated current demand at 989,000 barrels per day, an increase (⬆) of 350,000 barrels daily from the previous report week
Natural Gas
Spot natural gas futures prices were little changed last week. This continued a pattern in place this summer in which prices have not responded meaningfully to many regional weather events, intense heat and growth in domestic supply

Increases in natural gas in underground storage have more-or-less stalled, adding only 0.6 Bcf to supply over the past sixty days. The year-on-year surplus is now only 222 Bcf more than the five-year average, and 462 Bcf more than last year at this time.
Cooling Degree Days are outpacing normal accumulation. The nation as a whole added 13 CDDs more than normal for the last week of August. The Southwest, largely Texas, suffered under 136 CDDs, 26 more than normal and 20 CDDs more than last year. And Pacific States had 20 CDDs more than normal.
Powerhouse has discussed the opening of foreign markets to American LNG, supporting demand. And last year, this was an important outlet for supplies. This year however, European storage in better supplied and will not offer the same new markets as last year.
Natural gas’s next rally is harder to see, with summer’s heat now fading. Technical charts show a weak uptrend line in place since last April. And if prices continue to flatline around $2.58 spot, that line could soon be intercepted, leaving bullish traders out on a limb. Support is now around $2.45. A break invites further selling but with winter ahead and expectations of El Nino cold, a test much below $2.00 may not be in the cards.
Net injections into storage totaled 33 Bcf for the week ending September 1, compared with the five-year (2018–2022) average net injections of 60 Bcf and last year’s net injections of 55 Bcf during the same week. Working natural gas stocks totaled 3,148 Bcf, which is 222 Bcf (8%) more than the five-year average and 462 Bcf (17%) more than last year at this time.
Source: EIA
According to The Desk survey of natural gas analysts, estimates of the weekly net change to working natural gas stocks ranged from net injections of 31 Bcf to 58 Bcf, with a median estimate of 41 Bcf.
The average rate of injections into storage is 5% lower than the five-year average so far in the refill season (April through October). If the rate of injections into storage matched the five-year average of 11.1 Bcf/d for the remainder of the refill season, the total inventory would be 3,817 Bcf on October 31, which is 222 Bcf higher than the five-year average of 3,595 Bcf for that time of year.