- Petroleum demand in China slowing
- Aging workforce a barrier to growth
- China’s exports of petroleum products on the rise
- Drought slowing traffic through the Panama canal

The Matrix
The ascendance of China has been the demand story of this century so far. In 2000, China’s oil consumption was 4.3 million barrels per day. Since then, demand has almost quadrupled, peaking in the second quarter of this year at an estimated 16.4 million barrels per day. But China’s decades-long streak of exceptional growth appears to be running out of steam, which could have global implications for energy prices.
Even though China has moved towards a more market-based economy, the government still has considerable power. Beijing has poured money into housing, factories, and infrastructure, keeping employment and commodity demand high. Now China is faced with empty buildings and underutilized roads and bridges. All this building comes with a cost, and debt is growing as the economy slows.
Another part of China’s growth story has been its demographics. In 2000, the population was 1.27 billion. That number is now over 1.4 billion. During this time, large numbers have moved from rural farming into cities, fueling economic growth. Because Chinese officials had worried that the population was growing too fast, a one-child policy was in place from 1980-2016. Now, China’s working-age population is peaking, which is also a barrier to growth.
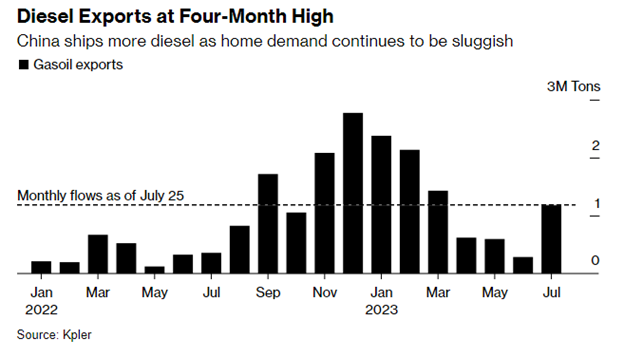
With demand falling, exports are starting to pick up. China’s refineries are benefiting from strong global distillate crack spreads and are running at near-record rates. Diesel exports are up substantially year-on-year. Reuters reported that exports of petroleum products more than doubled in July. The government sets quotas for product exports. Given the high rate of refinery runs, expectations are that exports, particularly of diesel, should expand in the 4th quarter.

Will China’s slowdown be enough to cool prices? Saudi Arabia has been committed to recent production cuts, offsetting reduced demand. Low product inventories outside of China continue to support the market and Beijing can still add stimulus. Headlines of China’s economic woes have been enough to stall the price rally that started last Spring. If economic data continue to disappoint, our energy markets will take notice
Supply/Demand Balances
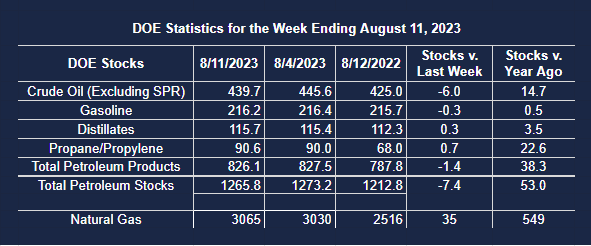
Supply/demand data in the United States for the week ending August 11, 2023 were released by the Energy Information Administration.
Total commercial stocks of petroleum fell (⬇) 7.4 million barrels to 1.2658 billion barrels during the week ending August 11, 2023.
Commercial crude oil supplies in the United States were lower (⬇) by 6.0 million barrels from the previous report week to 439.7 million barrels.
Crude oil inventory changes by PAD District:
PADD 1: Unchanged (=) at 8.5 million barrels
PADD 2: Down (⬇) 1.6 million barrels to 117.4 million barrels
PADD 3: Down (⬇) 5.0 million barrels to 243.5 million barrels
PADD 4: Down (⬇) 0.3 million barrels at 24.0 million barrels
PADD 5: Up (⬆) 0.8 million barrels to 46.2 million barrels
Cushing, Oklahoma inventories were down (⬇) 0.8 million barrels from the previous report week to 33.8 million barrels.
Domestic crude oil production was up (⬆) 100,000 barrels at 12.7 million barrels daily.
Crude oil imports averaged 7.158 million barrels per day, a daily increase (⬆) of 476,000 barrels. Exports increased (⬆) 2.239 million barrels daily to 4.599 million barrels per day.
Refineries used 94.7 percent of capacity; 0.9 percentage points higher (⬆) than the previous report week.
Crude oil inputs to refineries increased (⬆) 167,000 barrels daily; there were 16.746 million barrels per day of crude oil run to facilities. Gross inputs, which include blending stocks,increased (⬆) 164,000 barrels daily to 17.302 million barrels daily.
Total petroleum product inventories decreased (⬇) by 1.5 million barrels from the previous report week, up to 826.1 million barrels.
Total product demand increased (⬆) 936,000 barrels daily to 21.663 million barrels per day.
Gasoline stocks decreased (⬇) 0.3 million barrels from the previous report week; total stocks are 216.2 million barrels.
Demand for gasoline decreased (⬇) 451,000 barrels per day to 8.851 million barrels per day.
Distillate fuel oil stocks increased (⬆) 0.3 million barrels from the previous report week; distillate stocks are at 115.7 million barrels. EIA reported national distillate demand at 3.648 million barrels per day during the report week, a decrease (⬇) of 114,000 barrels daily.
Propane stocks increased (⬆) by 0.7 million barrels from the previous report week to 90.6 million barrels. The report estimated current demand at 1.244 millionbarrels per day, an increase (⬆) of 440,000 barrels daily from the previous report week.
Natural Gas
The Panama Canal expansion finished in 2016 allowed more giant tankers of LNG to use the canal, reducing the transit time and costs for U.S. gas to reach Asia. As a result, it is now a significant route for LNG trade. An unprecedented drought has reduced water levels and slowed traffic going through the canal. Even though LNG ships have shallower drafts that allow them easier passage, they still face a backlog of vessels waiting for a slot to pass. So far, the impact has been minimal. Ultimately ships can take longer routes at higher costs. But if a threatened strike by workers in Australia comes to pass, the bottleneck could further increase the costs of global LNG trade
From the EIA:
Working gas in storage was 3,065 Bcf as of Friday, August 11, 2023, according to EIA estimates. This represents a net increase of 35 Bcf from the previous week. Stocks were 549 Bcf higher than last year at this time and 299 Bcf above the five-year average of 2,766 Bcf. At 3,065 Bcf, total working gas is within the five-year historical range
