- Oil prices move higher
- Demand estimates for 2024 raised
- Distillate fuel oil situation eases
- Natural gas upside faces uphill battle
The Matrix
An improved economic outlook and projections of expanded world oil consumption gave petroleum futures markets their first weekly increase in two months. Prices of spot WTI crude oil ticked just below $68 before settling for the week at $71.43.
There was nothing extraordinary about the week’s activity from a technical chart perspective. The positive close was the first such recovery since prices topped in late September at $95.03.
The announcement of positive demand expectations in a week when a major international conference focused on limiting growth in petroleum’s share of world energy supply served as a relief valve for the oil industry.
The International Energy Agency (IEA) has projected global demand for petroleum to rise 1.1 million barrels per day in 2024. This reflects lower oil prices now, and a more positive outlook for interest rates in the United States.
The IEA forecast stands in contrast with that of OPEC. The cartel expects a larger increase of 2.25 million barrels daily in 2024 demand. The possibility of even more supply to global markets coming from the United States remains a factor limiting the upside.
The Department of Energy released the U.S. Petroleum Balance Sheet for the Week ending December 8, 2023. This offered a more bullish view of petroleum availability. The nation reduced its inventory of all oils by 10 million barrels. 4.3 million barrels of this decline was crude oil, offset by modest gains in distillate fuel oil (+1.5 million barrels) and gasoline (+400,000 barrels.)
Distillate fuel oil’s supply situation has changed a bit. There are now 113.5 million barrels of distillate fuel oil in stock. This represents a move away from the 100 million barrels often used as a minimum requirement by the industry.
At the same time, however, demand for distillate fuel oil clocked in at 3.770 million daily barrels daily. This was less than the average for the year to date, reflecting, of course, the impact of reduced HDDs on demand.
The result of more inventory and lower demand has been a move above 30 days’ supply, a closely watched data point.

Statistics need analysis and this week’s data offer a perfect example. Days’ Supply has improved, but because of softer demand and only marginal improvement in storage. If weather patterns shift, a rally in distillate fuel oil prices cannot be excluded.
Supply/Demand Balances
Supply/demand data in the United States for the week ending December 8, 2023 were released by the Energy Information Administration.
Total commercial stocks of petroleum down (⬇) 10.0 million barrels to 1.2593 billion barrels during the week ending December 8, 2023.
Commercial crude oil supplies in the United States were lower (⬇) by 4.3 million barrels from the previous report week to 440.8 million barrels.
Crude oil inventory changes by PAD District:
PADD 1: Down (⬇) 1.3 million barrels to 8.0 million barrels
PADD 2: Up (⬆) 1.3 million barrels to 112.0 million barrels
PADD 3: Down (⬇) 2.8 million barrels to 247.9 million barrels
PADD 4: Up (⬆) 0.1 million barrels to 24.5 million barrels
PADD 5: Down (⬇) 1.6 million barrels to 48.3 million barrels
Cushing, Oklahoma inventories were up (⬆) 1.2 million barrels from the previous report week to 30.8 million barrels.
Domestic crude oil production was unchanged (=) at 13.1 million barrels daily.
Crude oil imports averaged 6.517 million barrels per day, a daily decrease (⬇) of 991,000 barrels. Exports decreased (⬇) 568,000 barrels daily to 3.771 million barrels per day.
Refineries used 90.2 percent of capacity; 0.3 percentage points lower (⬇) than the previous report week.
Crude oil inputs to refineries decreased (⬇) 104,000 barrels daily; there were 16.097 million barrels per day of crude oil run to facilities. Gross inputs, which include blending stocks, decreased (⬇) 61,000 barrels daily to 16.476 million barrels daily.
Total petroleum product inventories decreased (⬇) by 5.7 million barrels from the previous report week, up to 818.5 million barrels.
Total product demand increased (⬆) 1.468 million barrels daily to 21.079 million barrels per day.
Gasoline stocks increased (⬆) 0.4 million barrels from the previous report week; total stocks are 224.0 million barrels.
Demand for gasoline increased (⬆) 394,000 barrels per day to 8.859 million barrels per day.
Distillate fuel oil stocks increased (⬆) 1.5 million barrels from the previous report week; distillate stocks are at 113.5 million barrels. EIA reported national distillate demand at 3.770 million barrels per day during the report week, an increase (⬆) of 14,000 barrels daily.
Propane stocks decreased (⬇) by 1.0 million barrels from the previous report week to 95.9 million barrels. The report estimated current demand at 1.200 million barrels per day, an increase (⬆) of 202,000 barrels daily from the previous report week.
Natural Gas
The week of December 15 ended with a modest rally in natural gas futures prices. Spot futures settled at $2.491, a daily gain of 9.9 cents. Price bulls have been hard pressed to make the case for any further significant advance.
Several factors argue against the upside. A few bullish indicators a suggesting a rally, but these pale in comparison with the bearish impact of an unsupportive El Nino and growth in natural gas production.
Technically, the market has been oversold. Spot futures prices fell to $2.235 last week before recovering at week end. The Relative Strength Index was oversold, inviting a rally. But even this rally barely reached previous resistance. Even a further advance this week will have to contend with near-term weather-based bearish conditions, and longer-term increases in production.
El Nino continues to inhibit development of Heating Degree Days. The Climate Prediction Center of NOAA reported the cumulative shortfall of HDDs since January, 2023 of 163 HDDs compared with last year. The Middle Atlantic states (and the Pacific region) lagged last year by 280 HDDs. These were 29 percent fewer than last year.
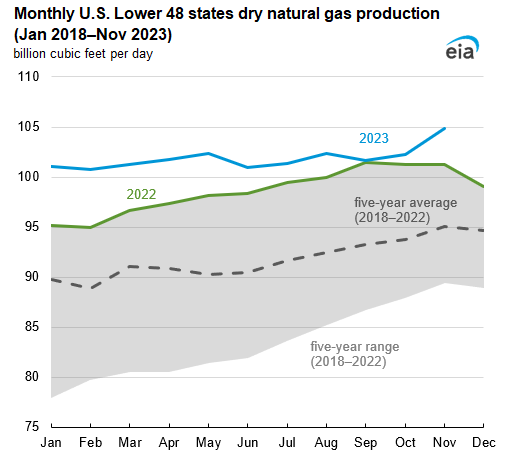
The effect of warmer weather was heightened by the country’s recent history of increased domestic natural gas production. The chart below was developed by EIA. It shows the production experience of last year and 2023 against the average range of the past five year. In particular, 2022 had steady growth for most of the year. This year, production has been even higher, but the rate of growth has been slowing. In 2022, production grew at 5.3 percent in the United States, falling to 3.3 percent thus far in 2023.
The growth this year has reflected expansion of offtake capability in the Marcellus region of the Appalachian Mountains. Further growth in Permian Basin output and in Oklahoma also contributed to new supply.
The EIA’s Short-Term Energy Outlook forecast total U.S. dry natural gas production would continue to increase in 2024, up 1.2% compared with 2023.
According to the EIA:
- Net withdrawals from storage totaled 55 Bcf for the week ending December 8, compared with the five-year (2018–2022) average net withdrawals of 81 Bcf and last year’s net withdrawals of 46 Bcf during the same week. Working natural gas stocks totaled 3,664 Bcf, which is 260 Bcf (8%) more than the five-year average and 245 Bcf (7%) more than last year at this time.
- According to The Desk survey of natural gas analysts, estimates of the weekly net change to working natural gas stocks ranged from net withdrawals of 46 Bcf to 63 Bcf, with a median estimate of 55 Bcf.