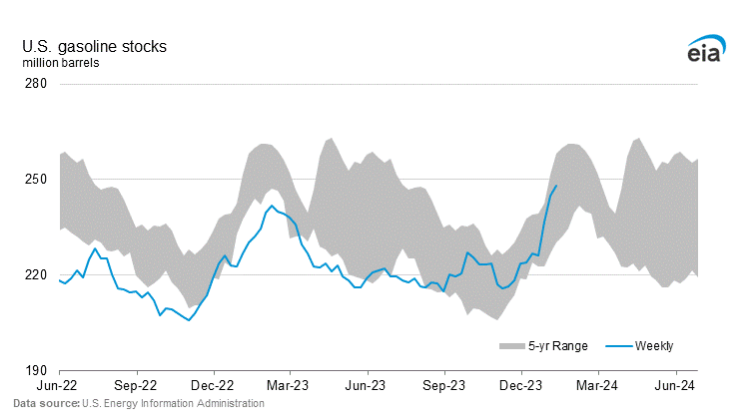
- Gasoline inventories adequate
- Spring driving season is next price mover
- Refinery turnarounds starting early
- Improved HDDs not enough to support natural gas rally
The Matrix
With yesterday’s close, front-month RBOB futures have now established a ‘higher high’ to accompany a ‘higher low’ since the mid-December price bottom at $1.9672. Over the last three weeks, open interest in the entire RBOB futures complex has increased by 11.4%. An increase in open interest during an advance in price indicates new, more bullish buyers are entering the market. While recent inclement weather has most likely curtailed demand, the cold weather has also significantly impacted refinery operations. One source reports that “sixteen refineries that account for roughly 22 percent of the country’s total capacity … reported upsets or unit shutdowns,” last week.
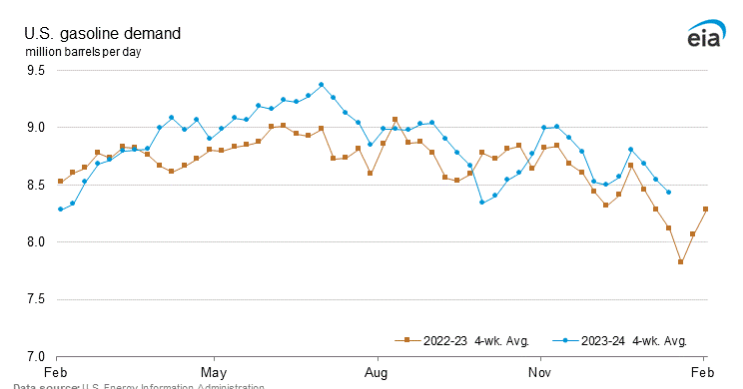
Gasoline demand, while declining on a seasonally expected basis, remains ahead of last year at the same time.
Due to healthy refinery throughput (running 93.1% of capacity on average over the four weeks versus 85.3% last year) U.S. gasoline stocks have increased significantly since November. However, early turn-around announcements at large refineries in Port Arthur, TX and Baton Rouge, LA are likely to affect this trend moving into the Spring months. If the bulls are to push the market higher, they will probably need to see a decline in the currently robust 29.4 days of gasoline supply.
The overall direction of the global economy retains the power to significantly affect well-established seasonal trends. Currently, the improving U.S. economy is trumping concerns surrounding weakness in the Chinese market. Should concerns about China grow more dire, the traditional Spring rally in refined products prices in the U.S. could be affected. As of now however, bullish sentiment is building in gasoline futures.
Supply/Demand Balances
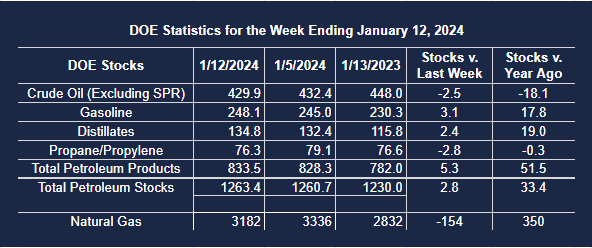
Supply/demand data in the United States for the week ending January 12, 2023 were released by the Energy Information Administration.
Total commercial stocks of petroleum rose (⬆) 2.8 million barrels to 1.2634 billion barrels during the week ending January 12, 2023.
Commercial crude oil supplies in the United States were lower (⬇) by 2.5 million barrels from the previous report week to 429.9 million barrels.
Crude oil inventory changes by PAD District:
PADD 1: Up (⬆) 0.7 million barrels to 7.8 million barrels
PADD 2: Down (⬇) 2.9 million barrels to 114.1 million barrels
PADD 3: Up (⬆) 0.3 million barrels to 235.8 million barrels
PADD 4: Down (⬇) 0.6 million barrels to 25.1 million barrels
PADD 5: Down (⬇) 0.1 million barrels to 47.0 million barrels
Cushing, Oklahoma inventories were down (⬇) 2.1 million barrels from the previous report week to 32.1 million barrels.
Domestic crude oil production was up (⬆) 100,000 barrels at 13.3 million barrels daily.
Crude oil imports averaged 7.420 million barrels per day, a daily increase (⬆) of 1.179 million barrels. Exports increased (⬆) 1.707 million barrels daily to 5.029 million barrels per day.
Refineries used 92.6 percent of capacity; 0.3 percentage points lower (⬇) than the previous report week.
Crude oil inputs to refineries increased (⬆) 135,000 barrels daily; there were 16.653 million barrels per day of crude oil run to facilities. Gross inputs, which include blending stocks, decreased (⬇) 56,000 barrels daily to 16.921 million barrels daily.
Total petroleum product inventories increased (⬆) by 5.2 million barrels from the previous report week, up to 833.5 million barrels.
Total product demand increased (⬆) 263,000 barrels daily to 19.869 million barrels per day.
Gasoline stocks increased (⬆) 3.1 million barrels from the previous report week; total stocks are 248.1 million barrels.
Demand for gasoline decreased (⬇) 57,000 barrels per day to 8.269 million barrels per day.
Distillate fuel oil stocks increased (⬆) 2.4 million barrels from the previous report week; distillate stocks are at 134.8 million barrels. EIA reported national distillate demand at 3.645 million barrels per day during the report week, an increase (⬆) of 213,000 barrels daily.
Propane stocks decreased (⬇) by 2.8 million barrels from the previous report week to 76.3 million barrels. The report estimated current demand at 1.397 million barrels per day, a decrease (⬇) of 194,000 barrels daily from the previous report week.
Natural Gas
Trading in natural gas spot futures opened this week on a soft note. Expectations of warmer weather continued to keep any bullish hopes in check. Since the $3.392 intraday high for the front month natural gas futures contract on January 9, 2024 the contract declined to an intraday low of $2.311, a massive 47% decline.
The opening price gap on Monday may possibly be what technicians call an exhaustion gap. An exhaustion gap signals a final spasm of selling intensity before an eventual bottoming action begins. If this is to be the case, then the front-month contract will need to move back above $2.514.
The week ending January 20 generated 53 more Heating Degree days than normal, with above normal HDDs throughout the country. The Central states were particularly impacted, adding roughly 100 HDDs more than normal.
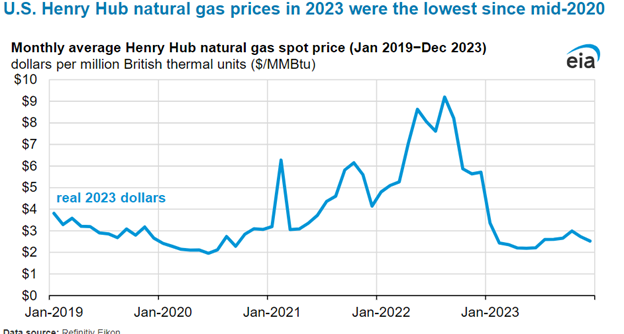
Beyond near-term weather, a major feature of natural gas activity has been growth in production, flat consumption and resulting inventory builds in the United States. These led to the lowest Henry Hub natural gas prices since mid-2020.
EIA reports the average Henry Hub price was below $3.00 per MMBtu in every month save January. The lowest price was the May average at $2.19 per MMBtu. Production of natural gas outpaced demand. EIA estimated U.S. dry natural gas output averaged 104 Bcf/d in 2023. This was about 4 percent more than in 2022.
Consumption grew 3 percent in 2023 vs. 2022. Heighted exports offset lower demand in the residential and commercial sector.
According to the EIA:
- Net withdrawals from storage totaled 154 Bcf for the week ending January 12, compared with the five-year (2019–2023) average net withdrawals of 126 Bcf and last year’s net withdrawals of 68 Bcf during the same week. Working natural gas stocks totaled 3,182 Bcf, which is 320 Bcf (11%) more than the five-year average and 350 Bcf (12%) more than last year at this time.
- According to The Desk survey of natural gas analysts, estimates of the weekly net change to working natural gas stocks ranged from net withdrawals of 132 Bcf to 176 Bcf, with a median estimate of 163 Bcf.
- The average rate of withdrawals from storage is 19% lower than the five-year average so far in the withdrawal season (November through March). If the rate of withdrawals from storage matched the five-year average of 15.6 Bcf/d for the remainder of the withdrawal season, the total inventory would be 1,953 Bcf on March 31, which is 320 Bcf higher than the five-year average of 1,633 Bcf for that time of year.